MARICOPA COUNTY
For eight straight years, Maricopa County has set a record for heat-related deaths. In 2023, there were 645 according to the Maricopa County Department of Public Health’s annual report, obliterating the previous record of 425 in 2022. From 2021 to 2023, thirteen times more people died of heat-related causes than from 2001 to 2003, just two decades before.
Heat-related death counts in Maricopa County now dwarf death counts that raised major alarm less than twenty years ago. In 2005, Phoenix suffered through what was then a record-breaking July heat wave, and 75 people died of heat-related causes in the county that year—dozens more than years prior. It made national headlines: the New York Times reported on the “relentless and lethal blanket of heat” covering Phoenix. The deadly summer of 2005 was so worrisome that county policymakers responded by implementing several measures designed to address the problem, including cooling centers and new systems to track and report heat-related illness and death. Yet last year there were more heat-related deaths in a three-day span (July 20 to 22) than in all of 2005.
Maricopa County's population has grown nearly 50% over the past few decades (blue line in chart above), but that only explains a tiny fraction of the growth in death counts. Indeed, even after converting raw death counts to rates to adjust for population (chart below), the dramatic upward trend looks almost the same. This accelerating upward trend is characteristic of exponential growth —the kind seen in the spread of infectious disease during an outbreak.
2023 in Maricopa County
2023 was the hottest and most deadly year in Maricopa County history. Deaths were relatively low during the first half of summer, however. June was one of the mildest in decades, with fewer deaths than previous years. But June 30th reached 110 degrees, beginning a historic heat wave of 31 consecutive days with a high of at least 110. There had never been more than 18 consecutive days that hot in the city’s history.
From July 14 to July 22, every day but one hit 116 or above. July 19th and 20th both reached 119. And there was scant relief from the heat at night. From July 10th to July 25th, the temperature never dropped below 90 degrees. On July 19, it only dropped to 97 degrees, the hottest low temperature ever recorded in the city. Before July 2023, Phoenix had never had a monthly average median temperature [2] of 100 or above. July’s average daily median temperature was 102.7.
The extreme July heat took a toll in human life—over 400 people died of heat-related causes that month alone, more than any full year before 2022. The chart below, with tall bars showing high death counts and the hottest days in the lightest shades of yellow, shows how the record-breaking July heatwave coincided with a dramatic and sustained wave of deaths.
Cooling monsoon rains never really arrived, and the hottest July ever was followed by the hottest August ever, with many more deaths. A brutally hot week at the end of August—clearly identifiable in the chart above by a corresponding spike in deaths—topped out at 117 degrees on the 28th, one degree short of the hottest temperature ever recorded that late in the year. Another 145 people died in August.
Some populations were hit harder than others. More than three-fourths of the victims were men, and over 60% were over 50. The average female victim was much older than the average male. Racial minority groups, including non-white Latinos, Blacks, and American Indians, generally had disproportionately high death rates. Whites, who comprise about 80% of the population, accounted for about 60% of the victims. Substance use was a factor in nearly two-thirds of all deaths; methamphetamine was the most common drug detected.
About three-fourths of heat-related deaths occurred outside, and about half the people who died were homeless. Around 40 deaths occurred among people engaged in physical or recreational activity. But indoor deaths nearly doubled from the previous year and have generally been increasing as a percentage of deaths since 2020, reversing a previous trend in which indoor deaths had been declining.[3] Indoor victims tended to be much older than outdoor victims: 72% of indoor victims were over 65 versus only 19% of outdoor deaths.
Worsening urban heat and its contribution to heat-related deaths
Environmental heat is by definition a cause or contributing factor in every heat-related death, which makes it unique among the factors we discuss. Heat-related deaths generally do not occur unless it is hot. More than three in every four heat-related deaths in Maricopa County from 2018 to 2023 occurred on days when the median temperature was at least 95 degrees; almost half were on days where the median was at least 100. About 7.5 people died per day on average on days with a median temperature of at least 100.
And of course people do not die from the heat when it is cool. Only about one percent of heat-related deaths occurred on days with a median temperature under 80 degrees, and some of those deaths were likely recorded on a date other than the date where the deadly exposure to heat actually occurred.
Phoenix summers have gotten hotter and hotter, partly from global climate change but more so from an urban heat island effect. An urban heat island occurs when temperatures inside a city become significantly hotter than surrounding rural areas because of asphalt pavement and other urban surfaces that absorb sunlight and release heat. The combined effect of global warming and the urban heat island effect have contributed to record or near-record summer heat in several of the past twenty years.
But Maricopa County has routinely set records for heat-related deaths (and death rates) in years without record overall summer heat, including six times in the last eight years. Some of the last eight years (highlighted in yellow below) had cooler summer temperatures than years not that long ago with just a small fraction of the number of heat-related deaths. For example, 2021 and 2022 both had record deaths without record heat. Both years had more deaths than 2020,[4] despite both having summers two to three degrees cooler.
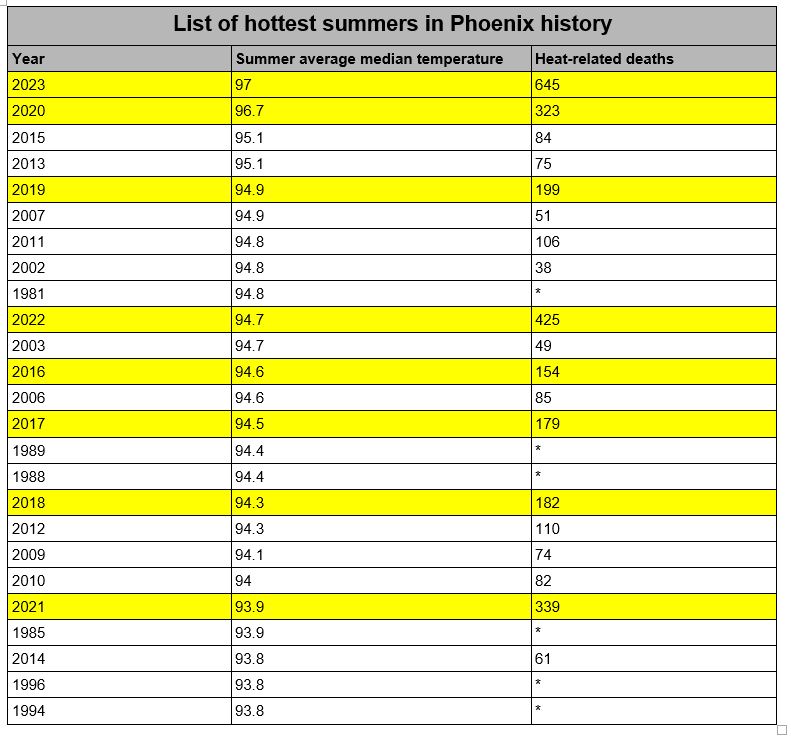
Could we be missing something about the environmental heat in 2021 and 2022 that made the heat in those years particularly deadly? It seems unlikely, even though our measure of summer temperatures is admittedly imperfect—it’s based on high and low daily temperatures in one place within a large urban area where temperatures may vary by several degrees on any given day. To be sure, the summers of 2021 and 2022 in Phoenix were still hot, and large numbers of heat-related deaths were not surprising. June 2021 was the hottest June ever in Phoenix. On June 17th, the temperature reached 118 degrees—part of a record-setting heat wave in which the high temperature reached 115 degrees or more for six consecutive days. More than 40 people died in just the final four days of this heat wave. Similarly, 2022 had another record-setting early-season heat wave, with four consecutive days over 110 degrees in early June, and the earliest day ever in Phoenix’s history where the temperature failed to drop below 90 degrees. But we have not seen anything that leads us to believe that the heat in 2021 or 2022 was inherently deadlier than 2020.
It thus seems apparent even at a glance that worsening urban heat is not the only factor that has been driving up heat-related deaths to record numbers year after year. This does not mean that worsening heat is not a factor in the increase in deaths, however. It just means that there must be other factors driving up deaths too.
If the increasing temperatures are responsible for some of the increase in deaths, but not all of it, the question then becomes, how much of the heat-related death epidemic is caused by increasing temperatures, and how much is caused by other factors? To try to isolate the effect of increasing temperatures, we first looked at how much hotter Phoenix has gotten since it first began recording heat-related deaths in 2001. We then used negative binomial regression to model the relationship between daily median temperatures and heat-related deaths to obtain a rough estimate of how much that temperature increase has increased deaths.
How much hotter has Phoenix gotten since 2001?
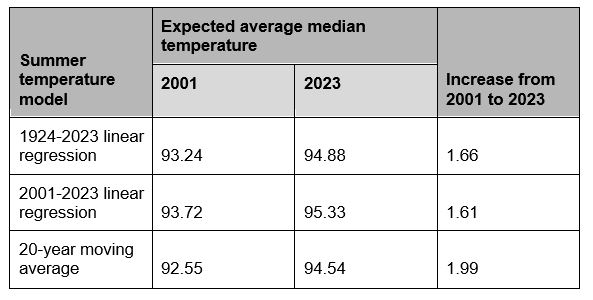
The chart below shows the average median summer temperature in Phoenix for the last 100 years.[5] The red line is the linear regression line based on the last 100 years of data. The blue line is the 20-year moving average for the last 80 years. The green line is also a linear regression line but only for years since 2001, the first year of our data for heat-related deaths.
The red regression line indicates that Phoenix summers are about 7.4 degrees warmer than they were 100 years ago. The fact that the recent trendline almost exactly parallels the 100-year trend line is an indication that the long-term warming trend has continued unabated since 2001. All three measures indicate a temperature increase between 1.6 and 2 degrees since 2001. We use this 1.6 to 2 degree range as our rough estimate of how much Phoenix has warmed since 2001.[6]
Phoenix's urban heat island effect
Climate change has contributed to rising temperatures in Phoenix as it has contributed to warming almost everywhere, but a substantial portion of the increase in Phoenix is actually caused by its significant urban heat island effect. Because the Phoenix metro area has grown much more dramatically over the past hundred years than other southern Arizona desert communities, Phoenix has warmed much more (7.4 degrees) than other communities such as Yuma (+4.8 degrees), Ajo (+3.3), Wittmann (+2.1), and Oracle (+1.8). Such disparities suggest that the urban heat island effect has caused more than half of the long-term warming in Phoenix—likely around five degrees.
Yuma, like Phoenix, is situated in the Arizona desert and is known for its blazing hot summer temperatures. But its growth has been much more modest than Phoenix, and it therefore has not built nearly as much sunlight-absorbing and heat-releasing urban infrastructure. The graph below, which shows the difference in average summer median temperatures between Phoenix and Yuma over the past hundred years, illustrates how Phoenix has warmed more than Yuma. Years when Phoenix has been hotter than Yuma are red, and years when Phoenix has been cooler are blue.
Until around 1970, Yuma was typically hotter than Phoenix in the summer. Geographically, this makes some sense, because Yuma sits at a lower elevation, and lower-elevation places are typically warmer than higher ones, all else equal. But since 1970, Phoenix has usually been hotter than Yuma. And the gap between the two appears to be widening—the summer of 2023 was more than four degrees hotter in Phoenix, the largest gap ever recorded.
Phoenix summer high temperatures usually get the headlines, but low temperatures are rising even faster. The following graphs show average daily high and low temperatures for June, July, and August for the last hundred years. The black lines are the 20 year-moving averages. Both high and low temperatures have increased in each month, but low temperatures have increased about two to three times as much as high temperatures. This is because sunlight absorbed by surfaces during the day is released as heat into the night.
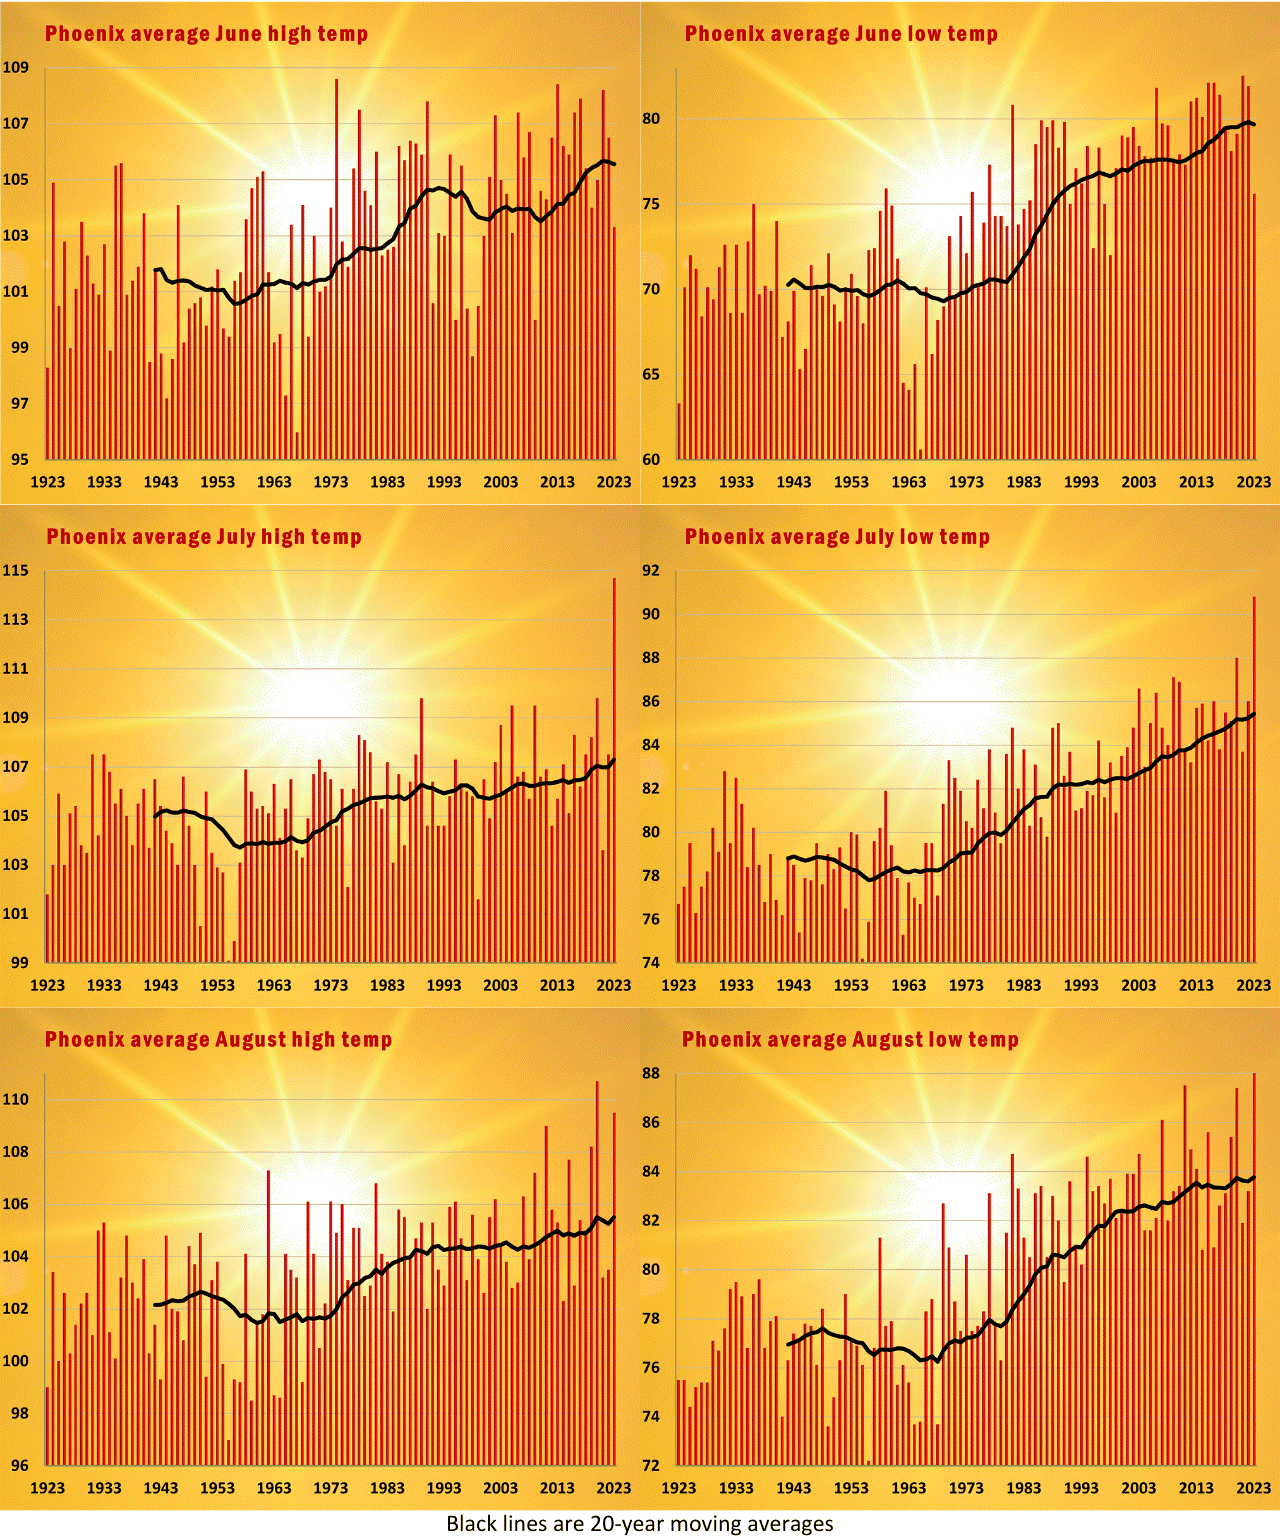
Average summer nighttime lows in Phoenix are about six to ten degrees warmer than they were just a few generations ago. Higher lows mean little relief from the heat at night. An unsheltered homeless person or a person living without adequate air conditioning thus may be constantly exposed to oppressive heat for months, and outdoor activity may not be enjoyable or safe for many, even at night.
How many more deaths result from higher temperatures?
To roughly estimate how much increasing summer temperatures have affected the heat-related death rate, we examine how variations in temperature appear to affect daily death counts. For example, if a one-degree difference in daily temperature affects daily death counts by a certain percentage, we theorize that a one-degree difference in average temperatures from one summer to another might be expected to affect death counts by roughly the same amount.
The following graph plots the median temperature and death count for each day from 2018 to 2023 (with a small amount of ‘jitter’ so that multiple days with the same death count and temperature are not plotted on top of each other). Each year is plotted in its own color. Previous studies in Maricopa County have found an exponential relationship between measures of temperature and heat-related death rates,[7] and our examination of the data confirms that relationship. The dots representing the days seem to arrange themselves in the characteristic accelerating upward bend of exponential growth curves.
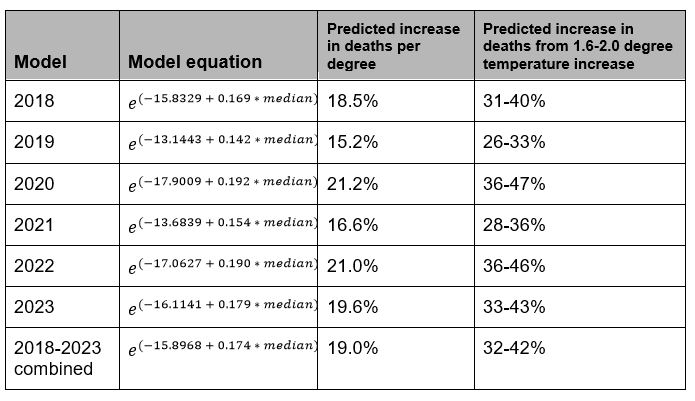
To analyze the data, we used the statistics program R to calculate the best-fitting negative binomial regression curve[8] for each year. These curves are plotted in the chart above, and represent how many people we’d expect to die on a hypothetical day with a given temperature in a given year. The black line represents the best-fit curve for all the days over the entire six-year period. The values along the black line represent how many people we’d expect to die on a hypothetical day of that temperature randomly occurring sometime between 2018 and 2023.
All of the models indicate that between 15.2% and 21.2% more people die per day for each additional degree. Both the 2023 model and the overall model from 2018 to 2023 indicate that the expected number of heat-related deaths in Maricopa County increases by between 19% and 20% per degree of increase in median temperatures. According to the 2023 and 2018-2023 models, our estimate of a 1.6-to-2.0-degree increase in daily temperatures would be expected to cause about a 32-43% increase in deaths.[9]
We think that an estimate at the high end of the overall range is probably more accurate because of a known source of error in the data. Deaths are reported in the data according to the day that the person dies, which is not always the last day that the person was exposed to deadly environmental heat. For example, a person may be exposed to heat one day but die in the hospital the next. We do not have data on how often this occurs, but we know that it does—for example, the health department flagged one death reported in January 2023 that resulted from exposure to heat during 2022.
We can also infer that this occurs from the unusually high death counts seen on certain cool days that immediately follow heat waves. For example, three deaths were recorded on July 23, 2021, a rainy day with a median temperature of only 78 degrees. Because people usually don’t die from the heat on days that cool—the 2018-2023 model predicts only 0.1 deaths for such a day—it’s very likely that the heat exposure that caused those deaths actually occurred on the previous day or days, all of which had median temperatures above 90. Likewise, eight deaths occurred on July 24, 2022, despite a median temperature of “only” 90 degrees. No other day between 2018 and 2023 with a median temperature under 95 had more than six deaths, and the 2018-2023 model predicts only 0.82 deaths at 90 degrees. Again, we suspect that most of the deaths on this day were caused by heat exposure on the preceding day or days, which were all six to fifteen degrees hotter.
Because deaths are more likely to occur on days with hotter temperatures, any lag between the day of exposure and the day of death will tend to assign the death to a cooler day more often than a hotter day. This effect would tend to “flatten” the curves by bending the curve upward at cooler temperatures and downward at hotter temperatures. The flatter curves have a lower estimated increase in deaths per degree.
To gain insight into the possible magnitude of this effect, we generated a model for 2022 with just one change in the data: we moved the eight deaths recorded on July 24 to July 22—the peak of the previous heat wave when the median temperature was an exceedingly hot 104.5 degrees. The altered model, shown in red below, bends upward more quickly than the actual 2022 model in blue, predicting 21.7% more deaths per each increasing degree of median temperature, up from 21.0% in the actual 2022 model.
This experiment leads us to believe that our models may somewhat underpredict how much each additional degree of heat increases death counts, but it seems unlikely that this effect causes the models to underpredict by such a large amount as to render them useless. Because day-to-day temperatures are highly correlated, most deaths that are not recorded on the day of last heat exposure are likely recorded on a day with a similar temperature, which wouldn’t affect the models much. There are few deaths recorded weeks or months after exposure; otherwise we would see a tail of deaths extending into fall and winter. Also, this source of error may have had a smaller effect in 2023, because so many deaths occurred during a sustained heat wave that was never broken by any significantly cooler days.
Thus, choosing a value toward the high end of the range indicated by the models, we roughly estimate that there were around 40% more heat-related deaths last year than there would have been if warming since 2001 had not occurred and temperatures were thus 1.6 to 2 degrees cooler. We emphasize that this estimate is a rough estimate, subject to many potential sources of error, including factors such as humidity, which tends to increase in the mid-to-late summer monsoon season despite generally being very low in Phoenix. It also does not account for how hot days are distributed in a year, and some studies have suggested a relationship between consecutive days of heat exposure and death rates.[10] Finally, our measure of average summer temperature is based only on the core summer months of June, July, and August, and some deaths occur every year in May, September, and even other months. We have not attempted to quantify such sources of error. Our estimate can be thought of as our current best guess about the magnitude of the effect of temperature increase on heat-related deaths; it is intended to provide some idea of how much increasing temperatures have contributed to heat-related deaths compared to vulnerabilities.
The portion of annual death rates that we estimate might be directly attributable to increasing temperatures since 2001 is shown in blue in the chart below.
Increasing vulnerability to the heat
The previous section suggests that increasing temperatures in Maricopa County explain some of the increase in its heat-related death rate, but a large portion of it remains unexplained at this point in our analysis. Indeed, the gray part of the bars in the chart above indicate that even if temperatures had not warmed since 2001, the population would still be suffering heat-related deaths at a much higher rate than it did in 2001. Similarly, we can see that the annual models above curve upward more sharply in recent years, meaning that more people die at a given temperature now than they did even just a few years ago. The likely reason for this is that the population has become more vulnerable to the heat.
People do not all face the same risk of death from the heat. Many people in Maricopa County are at low risk of heat-related death—for example, a relatively young and healthy person who is well-off financially, lives in a home with a powerful air conditioner, has a social network that will help them if their AC goes out, and doesn’t spend much time outside in the heat, is likely at very low risk of heat-related death. People who are able and have the means can also go on vacation someplace cooler for large portions of the summer, and many do.
Others have much higher risk of heat-related death. Studies have identified many factors that appear to increase vulnerability to heat, including respiratory or cardiovascular disease; living in an area with older infrastructure; lack of air conditioning in the home;[11] low socioeconomic status; low education level; occupations involving work outside of climate controlled environments; being unmarried or widowed, living alone, or being homebound;[12] and many others.
Older people tend to be vulnerable to heat-related death. For the past two years, people over 65 suffered heat-related death at nearly twice the rate of the overall population, comprising 29% of deaths despite being only 16% of the population. Because the percentage of older people in the population is growing, we considered whether aging demographics might be a major factor in the overall increase in the death rate. But only about 5% of the population has shifted into the more vulnerable over-65 group in the past 20 years or so (~16% in 2020, ~11% in 2000). Shifting 5% of the population into a demographic with twice the risk should have only increased the overall death rate about 5%—a very small increase when compared to the actual increase in the death rate, which is over 1000%.
Below, we discuss several major factors that are likely making the population much more vulnerable to heat-related death.
Homelessness
Homelessness—specifically unsheltered homelessness—is likely among the largest factors in the rise in heat-related deaths in Maricopa County. Maricopa County’s unsheltered homeless population has exploded over the past ten years. The number of unsheltered homeless people identified in Maricopa Association of Government’s (MAG) annual “Point-in-Time” count rose from just over 1,000 in 2014 to nearly 5,000 in 2023. And the actual numbers are probably higher; MAG only counts the unsheltered people they can find.
David Hondula, Director of Phoenix’s Office of Heat Response and Mitigation and an Arizona State University professor who has extensively studied urban heat, estimated that an unsheltered homeless person in Phoenix has 200 to 300 times greater risk of heat-related death than the overall population. An unsheltered homeless person is often outside and exposed to the heat for continuous and prolonged periods. Moreover, the homeless population has high rates of chronic physical conditions, drug addiction, and mental illness that increase vulnerability to heat. And because the homeless tend to have limited access to health care, their health conditions are often untreated.
The homeless population in Maricopa County far exceeds shelter capacity; in recent years, there have been more unsheltered homeless people than people living in shelters. Many homeless people in Phoenix lived in “The Zone,” a sprawling tent city around a downtown shelter and other homeless services that grew to well over a thousand people, until a court order forced the city to shut it down. Sources of temporary shelter are not enough to meet the needs of this population. Cooling centers are usually closed nights and weekends, and if a person is intoxicated, they likely won’t be allowed in. Other air conditioned public places like libraries may also only be available during weekdays or business hours.
Heat-related deaths among the homeless have risen dramatically since 2015 and now comprise a much greater percentage of overall deaths than they did in the past. From 2016 to 2019, deaths among the homeless constituted only about one-third of total heat-related deaths. But in three of the past four years, deaths among the homeless have outnumbered deaths among the non-homeless. And there is also an increasing percentage of heat-related death victims whose residency is classified as “unknown,” many of whom were likely homeless.
Drug use
Caleb Blair was only nineteen but was homeless and had developed chronic drug addictions. On June 10, 2022, the temperature climbed to 115 degrees in Phoenix, and Caleb, weakened from his chronic use and life on the street, high on fentanyl and methamphetamine, and suffering in the heat, sought relief in a convenience store. The clerk told him he could not remain inside, and he went back into the heat. A passerby soon noticed him in obvious distress and called 9-1-1. Police arrived first, handcuffed him, and dragged him to the shade of a mesquite tree. By the time medical personnel arrived, it was too late. Caleb’s body temperature was 109 degrees, and he died shortly after arriving at the hospital.
Drugs or alcohol were involved in nearly two-thirds of heat-related deaths in Maricopa County in 2023. Heat-related deaths involving drugs other than alcohol have exploded over the last decade and now represent a large and increasing portion of the overall increase in deaths. In 2012, only 11% of heat-related deaths involved drugs; in 2023, over half did (58%). In most heat-related deaths where substance use was a factor, it was a primary cause of death (72%).
One likely reason for this trend is that more people are using powerful and dangerous drugs. Although use of some illicit drugs such as cocaine and heroin has gone down according to estimates from the federal Substance Abuse and Mental Health Services Administration, the number of methamphetamine users rose 42% between 2017 and 2021, likely driven by cheaper and more plentiful supply. There were more than four times as many deaths in the county involving methamphetamine in 2023 than in 2015. Meanwhile, deaths involving fentanyl also dramatically increased—from around 50 in 2015 to over 1,300 in 2023. About half of methamphetamine and fentanyl deaths involve both.
Drug use increases vulnerability for several reasons. Chronic use of methamphetamine degrades overall health, and fentanyl use can also have serious negative health consequences beyond immediate death from overdose. Also, an addicted person’s health is often degraded by other circumstances that frequently accompany chronic addiction, such as loss of employment, social isolation, and homelessness. Intoxication can impair decision-making and lead to poor choices in the heat, or even render a person unresponsive; a person may die when they pass out in a parked car, for example. And a user’s appearance and/or behavior may deter people from assisting when the user is in distress from the heat.
Methamphetamine is a particularly deadly drug when combined with exposure to extreme heat, because it interferes with the body’s heat regulation system and thereby increases risk of heat stroke. 93% of heat-associated deaths involving drugs in Maricopa County in 2022 involved methamphetamine. For comparison, only 44% involved fentanyl, even though fentanyl use is also often deadly in the heat. Finally, there is anecdotal evidence that changes in the composition of street methamphetamine have made it more harmful in recent years than in the past.
Drug use is especially deadly when combined with unsheltered homelessness: substance use was involved in 87% of heat-related deaths among the homeless in 2022 and 89% in 2023. Caleb Blair’s story is an example of the many ways in which drug use combines with extreme heat to produce death: it likely factored in his homelessness, degraded his physical health, impaired his decision making, and contributed to appearance and behavior that may have made others less likely to help him.
Lack of air conditioning
Up until last year, the rate of outdoor heat-related deaths had increased faster than indoor deaths for a decade. But last year the trend reversed: indoor deaths increased 81% from 2022, whereas outdoor deaths increased only 43%. Indoor victims of the heat demographically differ from outdoor victims: they tend to be much older, much more likely to be female, and much less likely to have used substances.
In 2023, indoor deaths in places with an air conditioner doubled previous records. 136 heat-related deaths occurred indoors in places where an air conditioning unit was present, and most of those (117) involved units that were not operational. More people died in indoor places with non-functional air conditioners in 2023 than from 2012 to 2017 combined.
Many people likely died from lack of air conditioning last year because they could not pay for it. The cost of housing has skyrocketed: between 2014 and 2021, average rent in the Phoenix area increased by 60% while incomes increased only 23%. Median rent in the county was about $1,618 in 2022, up from $1,042 in 2016. Over 90% of apartments in the Phoenix metropolitan area rented for under $1,000 a month in 2010; by 2022 that had dropped to under 10%.
Meanwhile, an average Arizona household spends more money on air conditioning than households in any other state. And the average monthly household electricity bill in Arizona is higher than any other western state. Meanwhile, federal funding to assist low income people with heating and cooling bills is more or less the same as it was 20 years ago despite inflation and increasing population. The economic stress of high energy bills and housing costs may cause many to ration air conditioning or even go without it so they can meet other expenses such as food and health care. In a 2016 survey of homebound people in Maricopa County, almost a third of the respondents reported that their use of air conditioning was limited in some way by the cost —and that was before most of the recent rise in rents.
Rising rents and high energy costs tend to hit certain already vulnerable populations particularly hard, including the homebound and the elderly. Because these populations tend to live on low and/or fixed incomes, increases in essential expenses such as housing and utilities may make it difficult or impossible to fix or replace broken air conditioners, pay electric bills, or move out of rental housing with poor or nonexistent air conditioning. The record heat in 2023 likely resulted in even higher than normal energy bills, and the stress from constant operation in the heat may have broken more units than normal. A county program exists to help qualifying people pay to repair or replace broken units, but it appears that many still were unable to provide air conditioning for themselves when they needed it the most.
Social isolation
Eric Klinenberg studied the hundreds of deaths from a historic heat wave in Chicago in 1995 and concluded that the wave of deaths was largely caused by social isolation. In his extensive on-the ground research for his landmark book, Heat Wave: A Social Autopsy of Disaster in Chicago, Klinenberg found that most who had died had little contact from family, friends, neighbors, social agencies, or other support. He concluded that social isolation was a major risk factor for heat-related death: when people were alone and others were not regularly checking on them, there was often nobody to save them from the heat as they suffered and died. Studies have since confirmed that social isolation is a major factor in heat-related deaths: one study found that more social contact is strongly associated with lower heat-related death rates, for example. Klinenberg has mentioned that Chicago had far fewer deaths in a heat wave in which it had police officers and city workers go door-to-door to check up on elderly residents.
By many measures, Americans have become more socially isolated over the past several decades. A study from 2003 to 2020 showed that over that period people increasingly spent more time alone and less time with friends. In 2021, only about half of Americans reported that they had more than three close friends, down from 73% in 1990. Americans are participating less in clubs, religious groups, and other community organizations, and only 16% of Americans described themselves as very attached to their local community in 2018. People are also less trusting of others: in 2016 only 30% of Americans said they trusted other Americans, down from 45% in 1972. Marriage rates are declining and people increasingly live alone. Finally, pervasive use of modern technology and social media may be detracting from the quality of our interactions and increasing feelings of loneliness and isolation.
The onset of the COVID-19 pandemic in 2020 coincided with heat-related death numbers almost double the previous maximum in Maricopa County. Although 2020 also had a record hot summer, social distancing further isolated vulnerable people, making it less likely that someone would be there to help if someone was suffering from the heat. And while it is perhaps too early to tell whether the pandemic permanently reduced in-person social interaction, some early studies indicate that levels have remained low even after the pandemic itself eased.
Social isolation is often intertwined with other vulnerabilities. For example, research has shown that mortality from drug overdose is higher where social capital—an inverse measure of social isolation—is lower,[13] suggesting that social isolation may worsen problems with drug abuse.
And if people have trouble maintaining air conditioning for themselves, social isolation may make it less likely that a person will reach out for help—or have someone to reach out to.
Heat as a vulnerability factor
Above, we estimated that warming since 2001 has directly caused around 40% more heat-related deaths in 2023 than there would have been if warming since 2001 had not occurred. But that estimate was based on the effect of 1.6 to 2 degrees of additional heat on the current population. It did not take into account whether increasing temperatures might have also increased the population’s vulnerability to heat-related death over time. And there are reasons to believe that hotter summers may contribute to vulnerabilities we’ve discussed above, such as social isolation and inability to maintain adequate air conditioning.
Phoenix summers aren’t just hotter than they used to be; they are also getting longer. And more and more of that longer summer is becoming unsuitable for outdoor activity at any time of day. The following graph shows the number of days in Phoenix each year where the low temperature did not drop below 85 degrees. When the temperature does not drop below 85, outdoor physical activity may become unpleasant or dangerous for many even in the early morning when temperatures are near their daily lows. The number of these unbearably hot days has increased on average by more than a week per decade since 1950.
The hotter summers may be causing people to be less active over the long term, effectively hibernating inside for longer stretches in the summer. People in general may not be able to comfortably or safely participate in outdoor physical activity, which multiple studies have shown improves mental health. They may become more isolated because they engage less in social activities such as going out to restaurants. And some experts warn that increasingly hotter summers may contribute to mental health problems such as depression. There is even some evidence that our bodies adjust to the longer and hotter summers by seasonally slowing our metabolisms, not unlike other mammals that respond seasonally to the weather by hibernating and so forth. A recent clinical study of several hundred Phoenix-area residents who volunteered to be observed over several decades in 24-hour shifts in a respiratory chamber found that participants’ spontaneous physical activity—a measure linked with overeating and obesity—was significantly lower in the summer than in the winter.
Vulnerable people may become more isolated because those capable of physically checking in on them are also hibernating. And more people who are able may be leaving town in the summer to escape the heat. Although Arizona is known for seasonal migration into the state in the winter by “snowbirds,” researchers have long noted a “reverse snowbird effect” of residents leaving Arizona in the summer. Indeed, a 1996 study indicated that elderly Arizonans were more likely to leave Arizona in the summer than elderly Minnesotans were to leave their state in the winter.
Meanwhile, hotter temperatures add to economic stress, possibly interfering with the ability of people to stay cool in their homes. Hotter temperatures mean higher energy bills and more stress on air conditioning systems, which often have to run constantly because of the heat at night. With more units breaking down in extreme heat—and technicians themselves taxed by the extreme heat—people may have to wait longer or pay more for repairs. Even extra expenses attributable to hotter temperatures, such as car breakdowns that occur more frequently in extreme heat, may add to economic stress. While the individual effect of such factors may be small, their combined effect may significantly inflate the heat-related death rate over time.
Finally, the increasing heat may be hitting the hardest in areas with more vulnerable populations. Multiple studies of the Phoenix area have shown that poorer areas tend to be hotter, in part because the richer areas have more irrigated green space and higher tree canopy. Moreover, the hotter, less green areas tend to have higher minority populations. For example, a recent study of Phoenix found that areas with higher Hispanic populations tended to have fewer trees, even after adjusting for income.[14] Thus, populations that have been historically disadvantaged—and that may already be more vulnerable to heat as a result—may end up bearing the worst effects of increasing temperatures.
[2] We use median daily temperatures for our analysis because they incorporate both intensely hot daytime summer temperatures and the lack of relief at night characteristic of significant urban heat island effects.
[3] Before 2018, indoor deaths usually constituted about 40% of heat-related deaths in most years. Indoor deaths dropped to 28% of deaths in 2018, declined further in 2019 (24%), and reached a low point in 2020 (15%). Indoor deaths have increased somewhat since (25% in 2021, 20% in 2022, and 25% in 2023).
[4] 2020 was historically hot by many measures: Phoenix had a summer mean temperature more than 1.5 degrees hotter than the previous record, its hottest month ever (July), and its most 110-plus degree days ever by a wide margin. Many of the records set in 2020 were broken in 2023.
[5] All temperature data is collected and/or calculated from historical data available at the National Weather Service’s NOAA Online Weather Data dashboard, https://www.weather.gov/wrh/climate?wfo=psr. “Summer” in this paper is the months of June, July, and August.
[6] This estimate is based on statistical methods that all involve assumptions and sources of error. The linear regressions, for example, assume that the warming trend is perfectly linear, and it may not be—indeed, we see periods of several years that are warmer or cooler than the trend line that might indicate something other than warming at a constant rate. Moving averages are designed to filter out short term variation in the data—to filter out the “noise” to reveal the “signal”—but they may filter out some signal and retain some noise nonetheless. And the choice of a 20-year moving average, as opposed to a 10-year or 30-year or something else, is more or less arbitrary. Finally, there are many other statistical methods we could have used to arrive at an estimate.
[7] Fuyuen Yip et al., Impact of Excess Heat Events in Maricopa County, Arizona: 2000-2005, 52.8 Int. J. Biometeorology 765-772 (2008).
[8] Several different statistical regression methods exist for modeling exponential relationships, including non-linear least squares, Poisson, and negative binomial regression. These models differ in their implicit assumptions about the variance in the data, with Poisson and negative binomial models generally recognized as preferred over non-linear least squares for analyzing count data such as the data we analyzed here. We used negative binomial regression models on the convincing advice of our statistical consultant team that it was the most appropriate for our analysis because of its more flexible assumptions about the data variance. Because the data exhibited such a strong exponential relationship, Poisson and non-linear least-squares models returned similar results for the parameters we were most interested in, which were the rates of increase in deaths per degree of temperature increase. Thus our conclusions would not have differed substantially if we had used one of the other models.
[9] Exponential growth curves have a very convenient property for our analysis: for each unit of difference on the x-axis, the rate of change on the y-axis is constant. Therefore, the curves themselves can be used to estimate how many more deaths a given temperature difference would be expected to cause. Because the curves model constant exponential growth over the whole range of temperatures, error may be introduced to the extent that the data does not exhibit pure exponential growth over that whole range. For example, emergency measures such as cooling centers that take effect only at high temperatures could conceivably result in a lower growth rate in deaths at high temperatures.
[10] Yip, supra n.7.
[11] Id.
[12] C.J. Gronlund, Racial and Socioeconomic Disparities in Heat-Related Health Effects and Their Mechanisms: a Review, 1 Curr. Epidemiol. Rep. 165–173 (2014).
[13] Michael Zoorob & Jason Salemi, Bowling alone, dying together: The role of social capital in mitigating the drug overdose epidemic in the United States, 173 Drug and Alcohol Dependence 1-9 (2017).
[14] J.R. Nelson et al., The Equity of Tree Distribution in the Most Ruthlessly Hot City in the United States: Phoenix, Arizona, 59 Urban forestry & urban greening (2021).