 Read About Poverty Rates in Tucson, Arizona MSA
How are we doing?
Poverty Rate (2024)
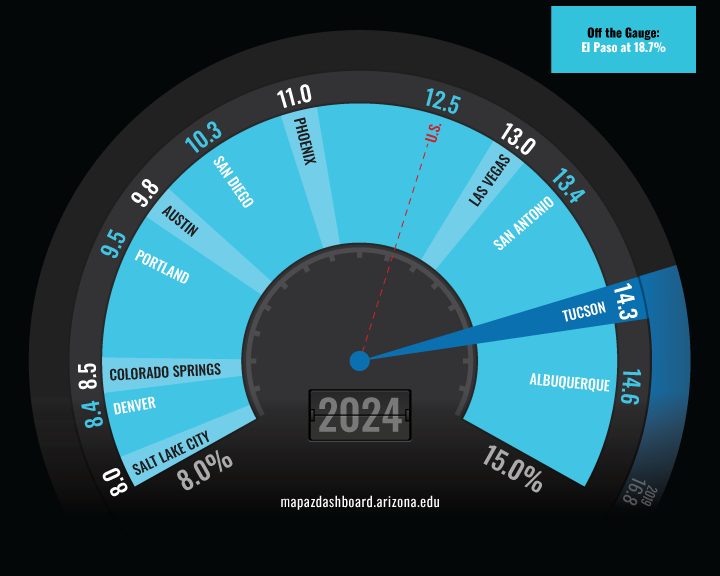
In 2024, the poverty rate in the Tucson Metropolitan Statistical Area (MSA) was 14.3%, ranking 10th among 12 western MSAs. Salt Lake City reported the lowest poverty rate at 8.0%, while El Paso had the highest at 18.7%. Although Tucson remains near the bottom of the peer group, the region has made progress over the past decade, with the poverty rate declining by nearly five percentage points since 2014.
Poverty rates vary considerably across demographic groups in Tucson. Rates were lowest among the population identifying as Two or More Races, Asian, and white, non-Hispanic. By age, children under 18 experienced the highest poverty rates, while adults aged 65 and over had the lowest. Poverty rates also differ by family type, with the highest rates found among female-headed households with children under five.
Why is it important?
The poverty rate is a key measure of financial hardship among households. Households with incomes near or below the poverty level often struggle to meet basic needs, including housing, food, transportation, and healthcare. At the local level, poverty rates help inform public policy and funding decisions. Poverty measures are often tied to government spending decisions on programs such as affordable housing, free and reduced school lunches, and other forms of public assistance. Higher poverty rates have been linked to broader economic and social challenges, including lower homeownership rates and reduced college participation. Poverty is an important indicator of both household well-being and regional economic health.
How do we compare?
In 2024, poverty rates in Tucson were higher than national rates for nearly all racial and ethnic groups. The exceptions were the Black and African American population and the Native Hawaiian and Pacific Islander population, whose rates fell below their U.S. counterparts. The American Indian and Alaska Native population experienced the largest gap, with a poverty rate nearly six percentage points above the national rate for this population. The white, non-Hispanic population posted the lowest poverty rate in Tucson at 11.2%.
Poverty rates in Tucson were higher than both state and national levels for children and working-age adults. Among those under 18, 18.6% lived in poverty in Tucson, compared to 16.2% in Arizona and 16.1% nationally. For adults ages 18 to 64, Tucson’s rate at 14.7% exceeded the Arizona rate of 11.8% and the national rate of 11.6%. Adults age 65 and older were the only group with a lower poverty rate in Tucson compared to the state and the nation.
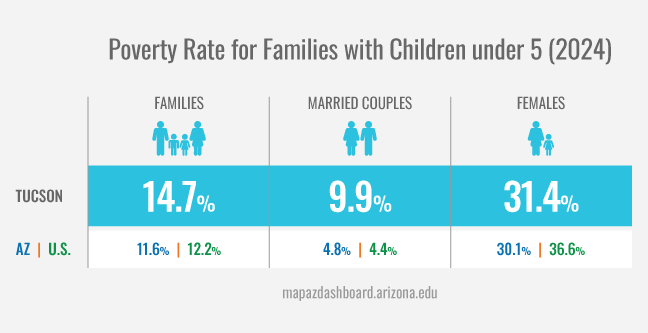
Families with children under five had poverty rates that were roughly comparable for the state of Arizona and the U.S., with Tucson’s rate slightly higher. Married couple-families reported significantly lower rates at 9.9% in Tucson, 4.8% in Arizona, and 4.4% in the U.S., though Tucson’s rate was more than double that of the state and nation. In contrast, female-headed households with no spouse present, and with children under five years, faced significantly higher poverty rates in all three geographies: 31.4% in Tucson, 30.1% in Arizona, and 36.6% nationally.
What are the key trends?
Between 2000 and 2014, poverty rates in Tucson, Arizona, and the U.S. increased substantially. In 2000, the poverty rate was 14.7% in Tucson, 13.9% in Arizona, and 12.4% nationally. Rates increased in the years that followed, driven in part by stagnant wages combined with rising housing and transportation costs. The effects of the Great Recession were evident in 2014, when the poverty rate reached a 20-year high. Since that time, the poverty rate has declined significantly. By 2024, Tucson’s poverty rate had fallen to 14.3%, below its 2000 level. Arizona also posted a lower poverty rate in 2024 than in 2000, while the U.S. rate declined to a level similar to its 2000 rate.
How is it measured?
Poverty rates are from U.S. Census Bureau American Community Survey (ACS) five-year estimates. Note that the ACS five-year estimates are produced over a five-year period and can only be compared with non-overlapping five-year estimates (for example, 2006-2010 and 2011-2015). Rates reported by the U.S. Census Bureau are derived from answers to ACS questions regarding household income, age, and family composition. Income includes “before tax earnings, unemployment compensation, workers' compensation, Social Security, Supplemental Security Income, public assistance, veterans' payments, survivor benefits, pension or retirement income, interest, dividends, rents, royalties, income from estates, trusts, educational assistance, alimony, child support, assistance from outside the household, and other miscellaneous sources”. According to the U.S. Census Bureau, a family is considered below the poverty level if its annual household income falls below a threshold based on income, age, and family size. For example, the poverty threshold for a family of five with three related children under 18 years in 2023 was $36,580.


