 Examine Outdoor Recreation Trends in Tucson, Arizona MSA
How are we doing?
Annual Growth Rate of National Park Visits by MSA (2025)
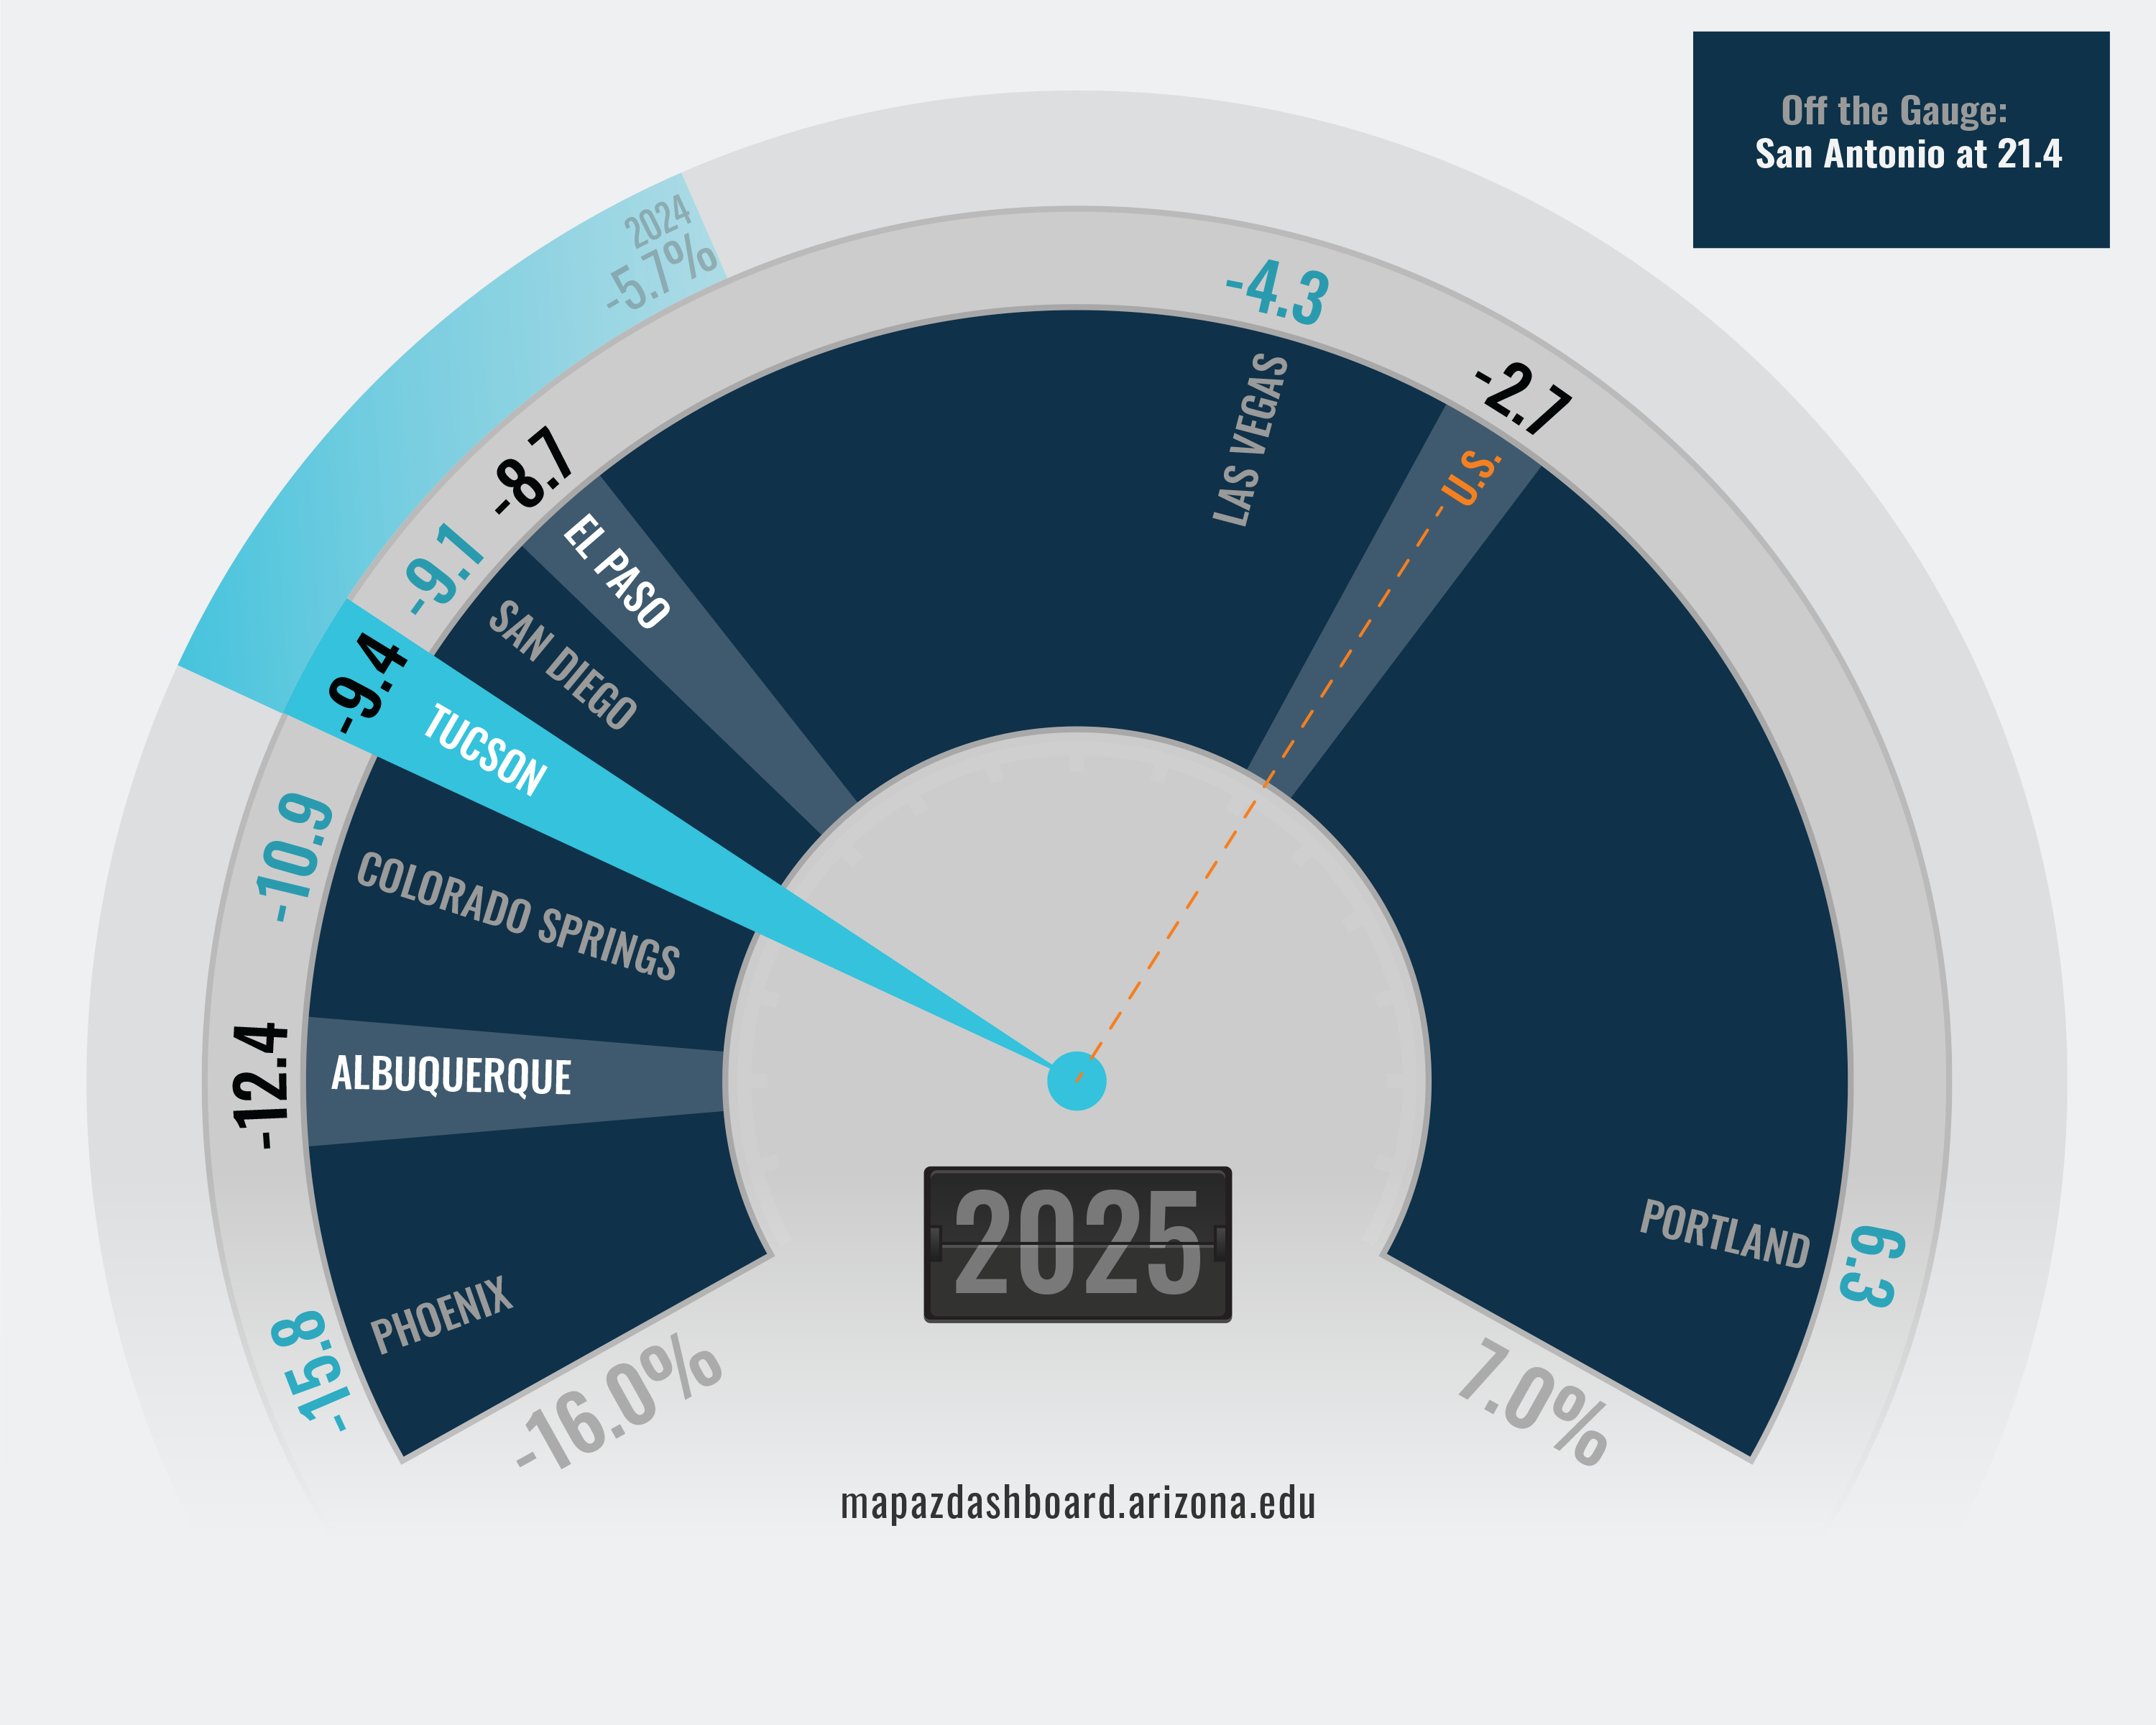
In 2025, national parks located in the Tucson Metropolitan Statistical Area (MSA) reported 1,022,372 visitors. That was a 9.4% decline from 2024, totaling 106,609 fewer visits. Tucson ranked near the bottom among peer western MSAs in annual growth in national park visitation. National park visits also declined in 2025, falling 11.0% in Arizona and 2.7% nationally.
*There are no national parks in the following Metropolitan Statistical Areas (MSAs) tracked on the MAP: Austin, Denver, and Salt Lake City.
Why is it important?
Outdoor recreational opportunities contribute to quality of life, public health, tourism activity, and economic development. Access to recreational land, parks, trails, and open space can support physical activity, attract visitors, and enhance a region's desirability for residents and businesses. Visitor spending associated with outdoor recreation also supports local industries such as lodging, restaurants, retail, and transportation. As a result, recreational amenities are often considered an important component of a region’s economic competitiveness and quality of place.
How do we compare?
In 2016, federal recreational land accounted for 29.0% of the Tucson MSA, ranking fifth among 12 peer western MSAs. Las Vegas ranked first, with 85.2% of its land designated as federal recreational land, while San Antonio ranked last. Tucson and Phoenix both reported a larger share of federal recreational land than the national average. In contrast, several Texas MSAs reported less than 1.0% of their land area in federal recreational uses.
What are the key trends?
National park visits in the Tucson MSA declined by 9.4% in 2025, following a smaller decline in 2024. National park visits also declined statewide and nationally in 2025, with Arizona posting the largest decline at 11.0%, compared to 9.4% in Tucson and 2.7% nationally. Despite recent declines, visitation levels remain well above those during the pandemic, when many national parks were partially or fully closed, and visits in Tucson fell by 25.7%.
Over the long term, visitation has fluctuated with economic conditions and travel patterns. Following declines during and after the Great Recession, Tucson and Arizona recorded five consecutive years of growth in national park visitation between 2013 and 2017.
How is it measured?
Federal recreational land is measured as the share of total land area designated as federal recreational land. This includes lands managed by the National Park Service, the U.S. Fish and Wildlife Service, the U.S. Forest Service, the Bureau of Land Management, and designated wilderness areas. Land-use estimates come from a 2019 Headwaters Economics report and reflect conditions as of 2016. National park visitation data come from the National Park Service (NPS), Integrated Resource Management Applications(IRMA) Visitor Use Statistics program, which reports annual visitation counts for national park units.


