 Read About Student Achievement Levels in Tucson, Arizona MSA
How are we doing?
NAEP Scores 4th Grade Reading (2024)
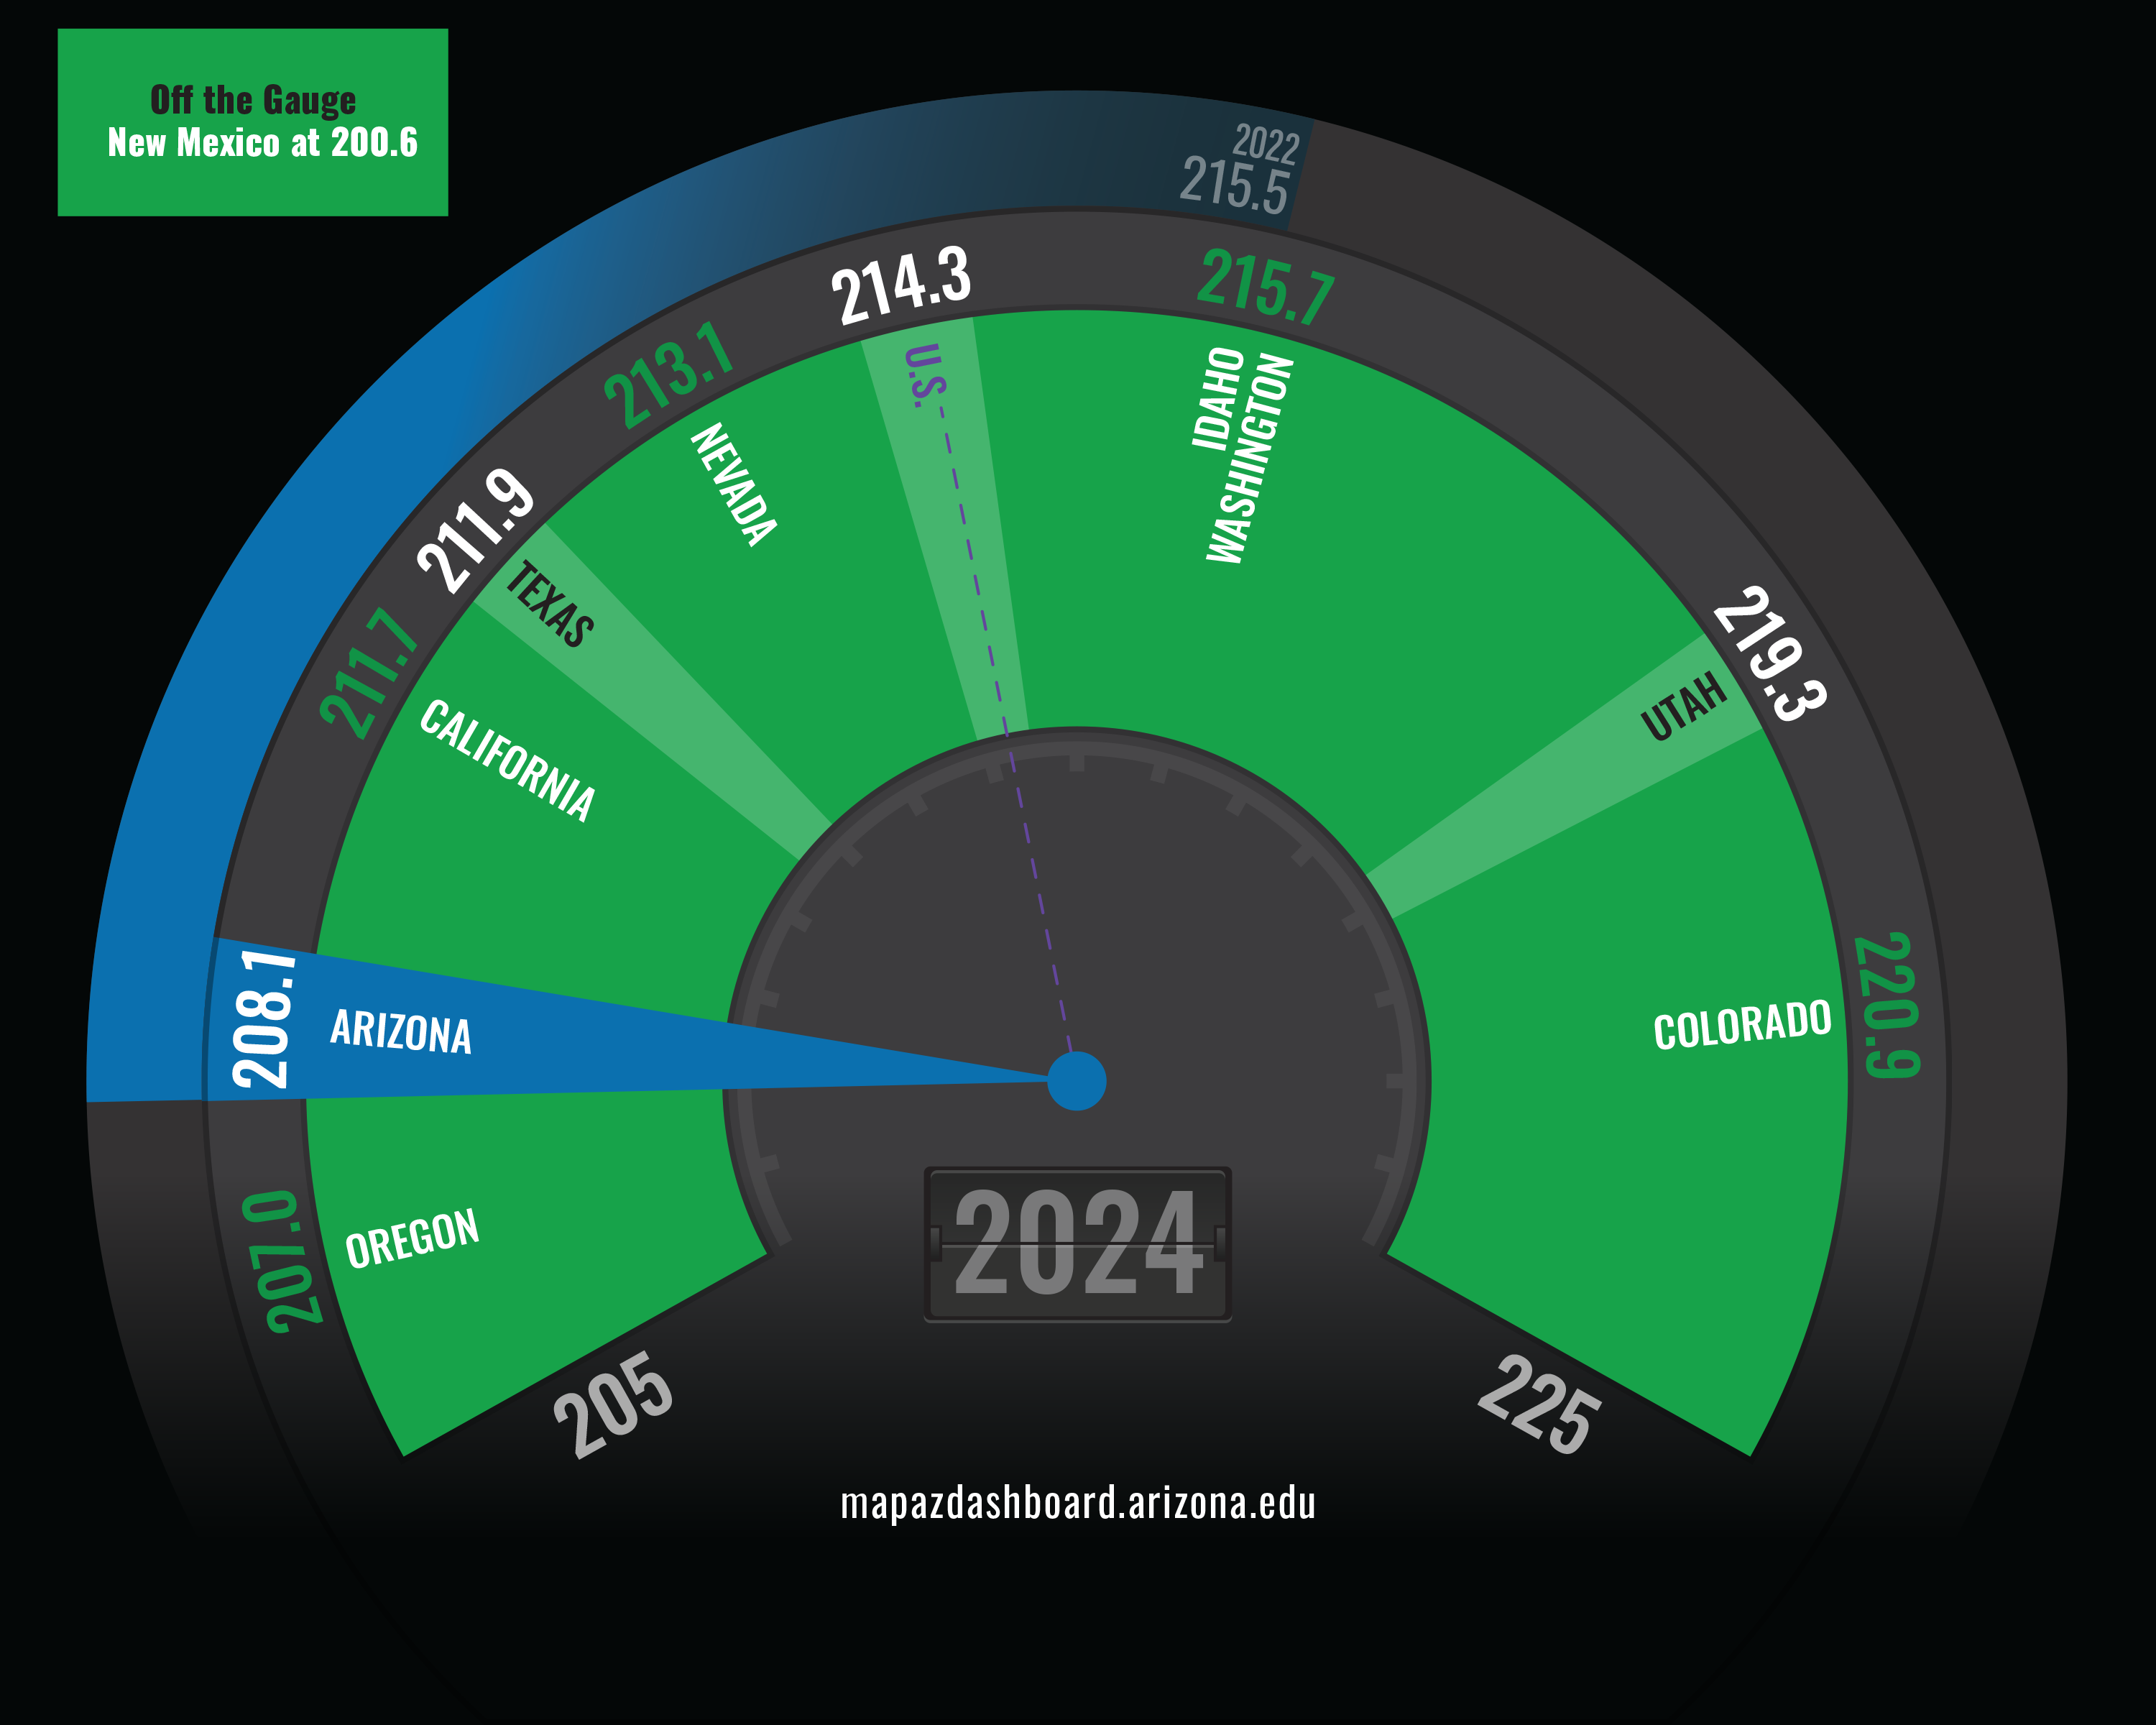
In 2024, Arizona ranked eighth among the 10 western states in fourth-grade reading scores on the National Assessment of Educational Progress (NAEP), well below the national average. Arizona experienced the largest decline among western states between 2022 and 2024, followed by Oregon, California, and Texas. Nevada and Idaho reported gains in fourth-grade reading scores. Arizona's eighth-grade math scores also declined slightly between 2022 and 2024.
Why is it important?
Standardized test scores are one measure of how effectively a region prepares students for higher education, workforce training, and future careers. Strong educational outcomes help develop a skilled workforce, support economic growth, and contribute to the region’s long-term competitiveness. High-quality schools can also enhance quality of life and influence where families choose to live and work. Student achievement is associated with future educational attainment, workforce participation, and earning potential.
How do we compare?
In 2025, 36.0% of third-grade students in Arizona passed the Arizona Academic Standards Assessment (AASA) in English Language Arts. Pima County reported a passing rate of 33.0%, below the statewide rate but higher than several other Arizona counties. Maricopa and Yavapai counties had the highest passing rates at 39.0%, followed by Graham County at 38.0%. Performance varied substantially across counties, with La Paz County recording the lowest passing rate at 19.0%.
AzM2 scores in 2021 were lower than those reported in 2019. Statewide testing was not administered in 2020 due to the COVID-19 pandemic, making comparisons across years challenging. In 2022, Arizona introduced the Arizona Academic Standards Assessment (AASA), which replaced AzM2. Because the assessments are not identical, results from AASA should not be directly compared with prior AzM2 or AZMERIT scores.
3rd Grade Students Passing the AASA English Language Arts Test (2025)

On the AASA math assessment, 27.0% of Arizona eighth-grade students met or exceeded state proficiency standards. Maricopa County reported the highest proficiency rate at 30% and was the only county to exceed the statewide average of 27.0%. Performance varied substantially across counties, with Pima County slightly below the state average of 25.0% and Gila County reporting the lowest proficiency rate at 11%.
In 2024, Arizona ranked eighth among western states in fourth-grade reading scores on the National Assessment of Educational Progress (NAEP), below the national average. Arizona students also scored below the national average in eighth-grade math. The 2024 eighth-grade math score was Arizona’s lowest since 2003. Despite the decline, Arizona ranked fifth among western states, a slight improvement from sixth place in 2022.
Scores for Arizona’s students varied by race and ethnicity, with nearly all races achieving higher proficiency rates in third-grade English Language Arts than in eighth-grade math. Asian students achieved the highest proficiency rates in both third-grade English Language Arts (64.0%) and eighth-grade math (67.0%). White students achieved the second-highest proficiency rates at 52.0% and 40.0%, respectively. Students identifying as two or more races reported proficiency rates that were seven percentage points lower than white students in third-grade English Language Arts and five percentage points lower in eighth-grade math. Hispanic or Latino students achieved proficiency rates of 26.0% in third-grade English Language Arts and 17.0% in eighth-grade math. Black or African American students reported proficiency rates of 24.0% and 16.0%, respectively. American Indian or Alaska Native students had the lowest proficiency rates, at 17.0% in third-grade English Language Arts and 10.0% in eighth-grade math.
What are the key trends?
Between 2003 and 2015, student achievement in Arizona improved more rapidly than the nation, allowing the state to narrow achievement gaps in both reading and math. Eighth-grade math scores increased steadily from 2003 to 2015, then declined in subsequent years. By 2019, Arizona's math scores had fallen below the national average. Fourth-grade reading scores also improved over time, rising from 208.9 in 2003 to 215.8 in 2019. While reading performance improved in Arizona, national scores remained relatively unchanged, reducing the gap between Arizona and the nation. During the COVID-19 pandemic, reading scores in Arizona remained relatively stable while national scores declined, further narrowing the gap between Arizona and the U.S. in reading performance. In 2024, reading scores in Arizona dropped to a near 20-year low.
How is it measured?
Each year, Arizona students in grades three through eight and high school take the Arizona Academic Standards Assessment AASA exam or the Multi-State Alternative Assessment (MSAA). These assessments measure student proficiency in English language arts and mathematics. The percentages reported here represent the share of students who met or exceeded proficiency standards on third-grade English language arts and eighth-grade mathematics assessments. Arizona adopted AzMERIT in 2015, replacing the AIMS assessment. In 2022, Arizona transitioned from AzM2 to AASA. National comparisons are based on average scale scores from the National Assessment of Educational Progress (NAEP), an ongoing assessment program administered by the National Center for Education Statistics within the U.S. Department of Education.


