 Explore Data on Air Quality in Tucson, Arizona MSA
How are we doing?
Percent of Good Air Quality Days (2025)
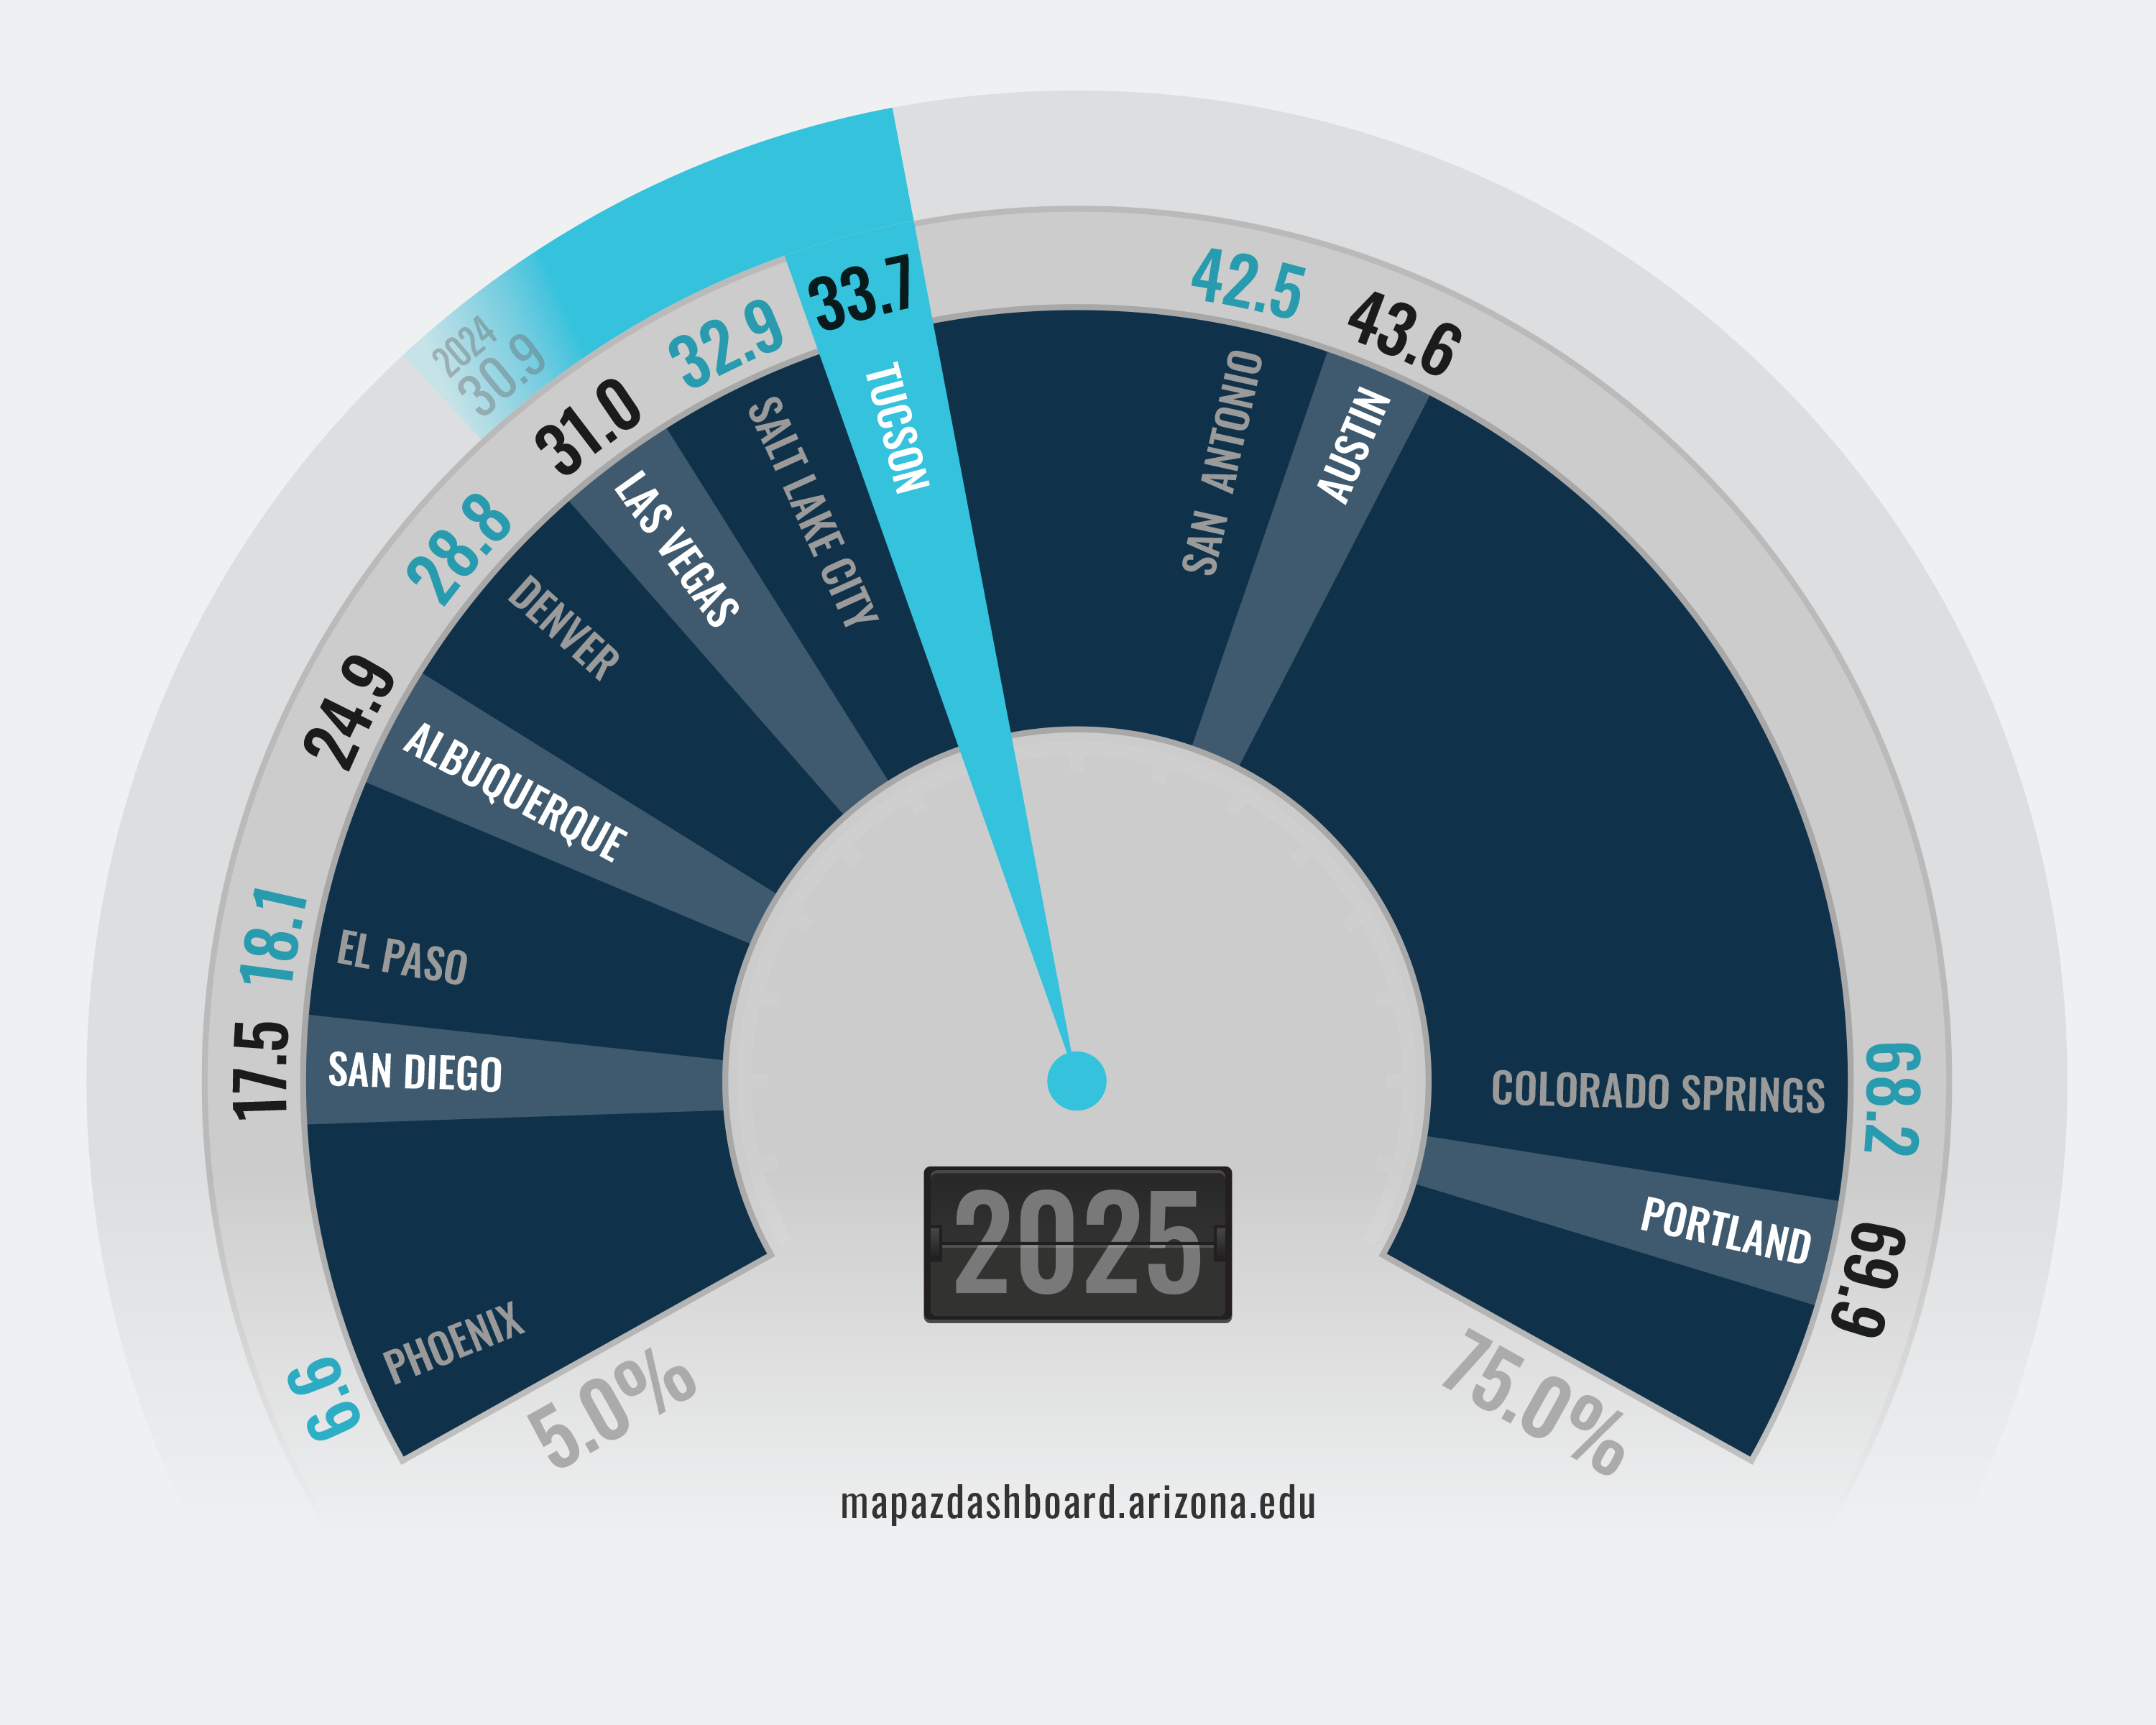
In 2025, air quality in the Tucson Metropolitan Statistical Area (MSA) was rated “good” 33.7% of the time. Among 12 western peer MSAs, Tucson ranked fifth in the share of days with good air quality. Portland ranked first at 69.9%, while Phoenix ranked last at only 6.6%. According to the Air Quality Index (AQI), days classified as "good" pose little or no health risk. Tucson’s share of good air quality days improved from 30.9% in 2024 to 33.7% in 2025. While conditions improved modestly over the year, regional dust events and wildfire smoke continued to affect air quality across the region.
Why is it important?
Air quality is an important component of regional well-being and can have significant implications for public health, the environment, and the economy. Poor air quality can pose greater risks for individuals with respiratory conditions and other health sensitivities, potentially contributing to higher healthcare costs and lost productivity. In addition, air pollution can cause damage to buildings, vegetation, and crops. Air quality is influenced by a range of factors, including traffic congestion, wildfire smoke, dust events, and industrial emissions. The Air Quality Index (AQI) categorizes air quality into six levels: good, moderate, unhealthy for sensitive groups, unhealthy, very unhealthy, and hazardous.
How do we compare?
In 2025, 97.8% of days in the Tucson MSA were classified as having either good or moderate air quality. An additional 1.6% of days were categorized as unhealthy for sensitive groups, while 0.3% were classified as either very unhealthy or hazardous. Overall, Tucson experienced fewer days with unhealthy air quality than many peer western MSAs. Among western MSAs, Phoenix reported the highest share of unhealthy air quality days, while El Paso recorded the highest percentage of days classified as very unhealthy or hazardous. In addition, very unhealthy air quality days trigger health alerts indicating an increased risk of adverse health effects for the general population, while hazardous days represent emergency conditions.
What are the key trends?
The share of air quality days rated “good” in the Tucson MSA has fluctuated in recent years, reaching a peak of 64.7% in 2015 before declining to a 20-year low of 25.5% in 2021. Conditions improved in 2022, when 40.3% of days were considered good, before decreasing to 33.7% in 2025. Tucson ranked fifth among 12 peer western MSAs in 2025, improving from sixth in 2024. Phoenix ranked last, with only 6.6% of days classified as “good.”
How is it measured?
Air quality data come from the U.S. Environmental Protection Agency’s Air Quality Index Report, an annual summary of AQI values for four major air pollutants. However, many areas lack monitoring stations for all pollutants. The AQI ranges from 0 to 500 and is divided into six categories: good (0-50), moderate (51-100), unhealthy for sensitive groups (101-150), unhealthy (151-200), very unhealthy (201-300), and hazardous (301-500). The EPA updated the ozone AQI in 2024, and the update applied to all historical data.