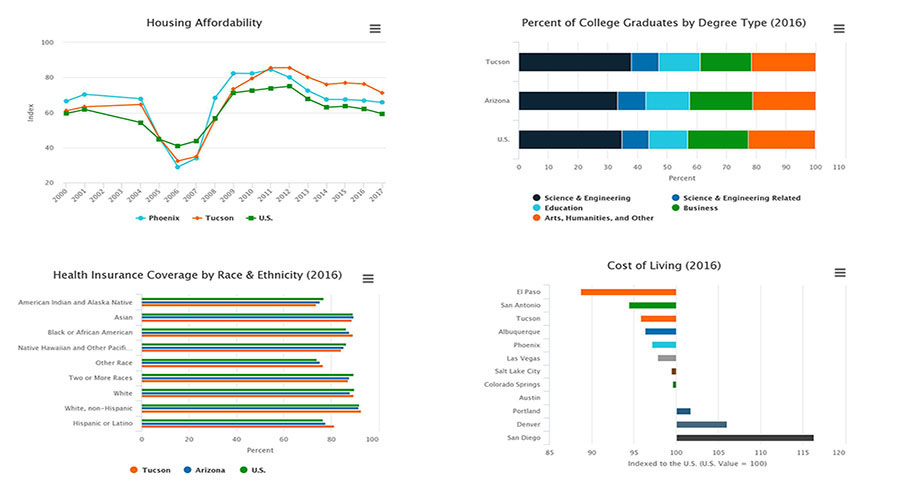
Welcome
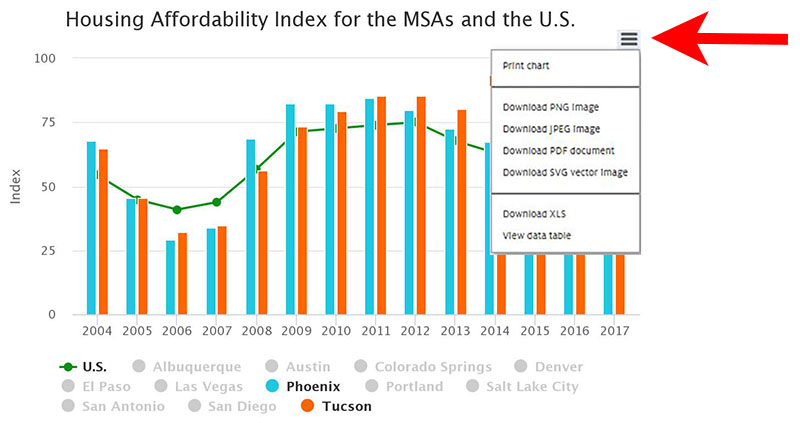
To download data from select interactive charts on the MAP Dashboard look for the (![]() ) icon located in the corner of the charts. See below for step-by-step instructions on how to print, download, or view the data from the interactive charts.
) icon located in the corner of the charts. See below for step-by-step instructions on how to print, download, or view the data from the interactive charts.
Click the icon (![]() ) to view the menu options.
) to view the menu options.
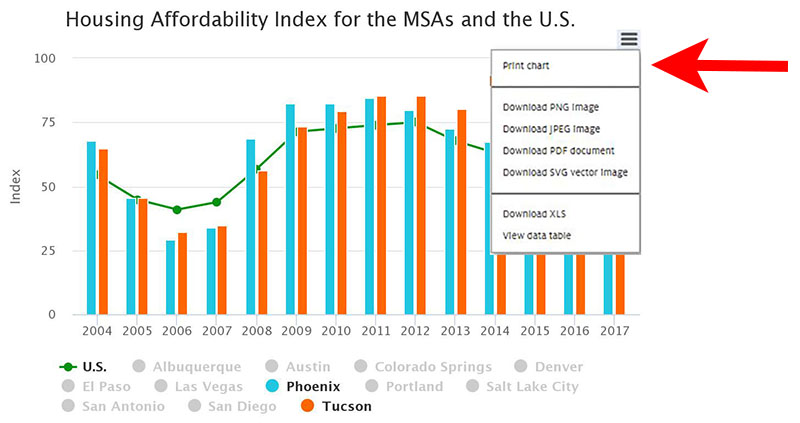
To print the chart, select "Print chart" from the menu.
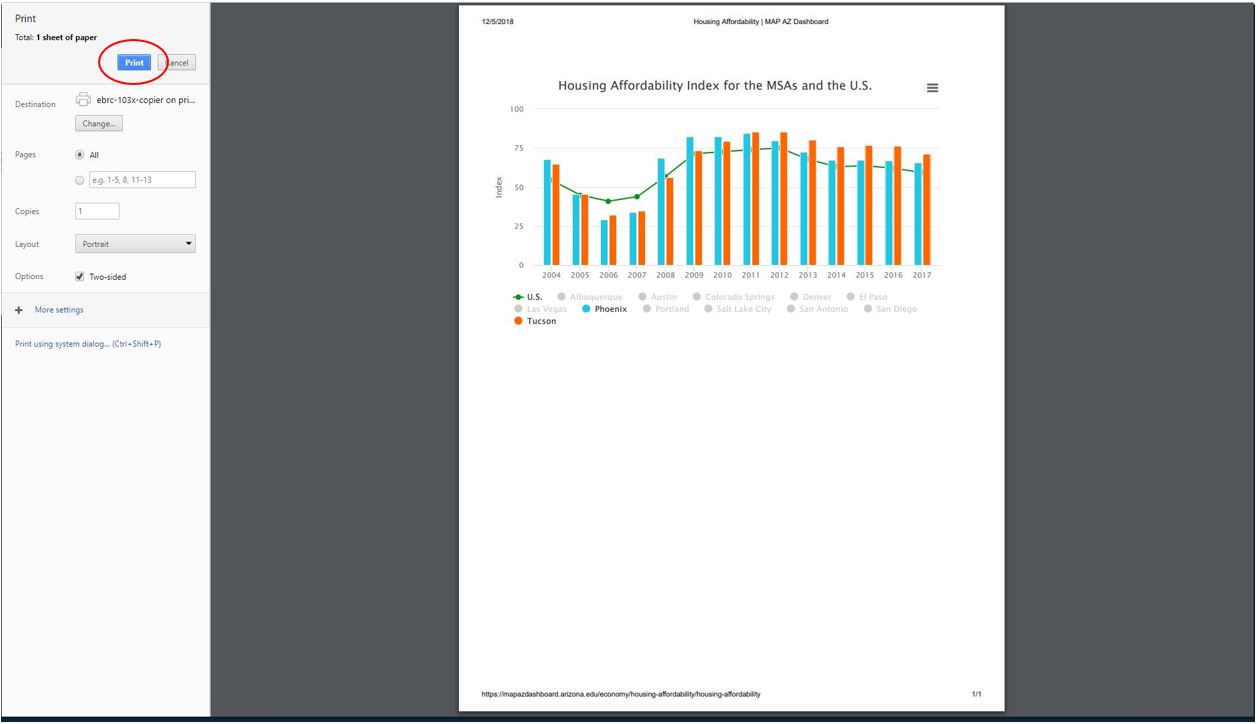
A print page will display with a page preview. From here, you can make your selections to print the chart.
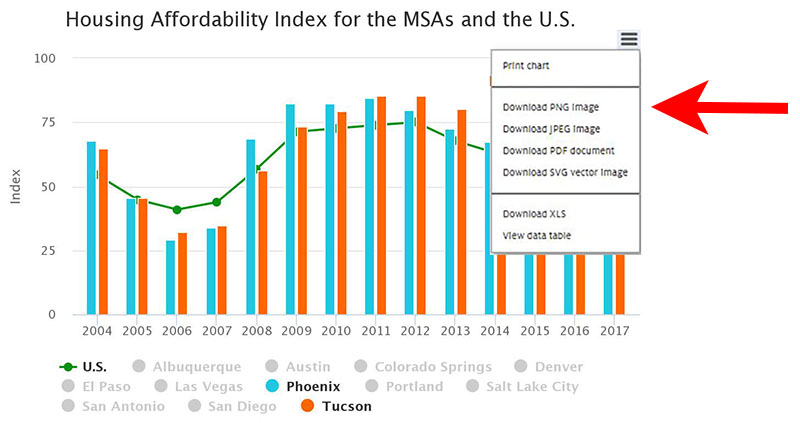
In the section under "Print chart," you can download the chart as a PNG image, a JPEG image, a PDF, or even a SVG vector image. To download an image, simply select the image type you would like to download. In this example, we will download a PNG image. Click "Download PNG image."
Select the file that pops up at the bottom of the screen (or at the top if using Firefox).
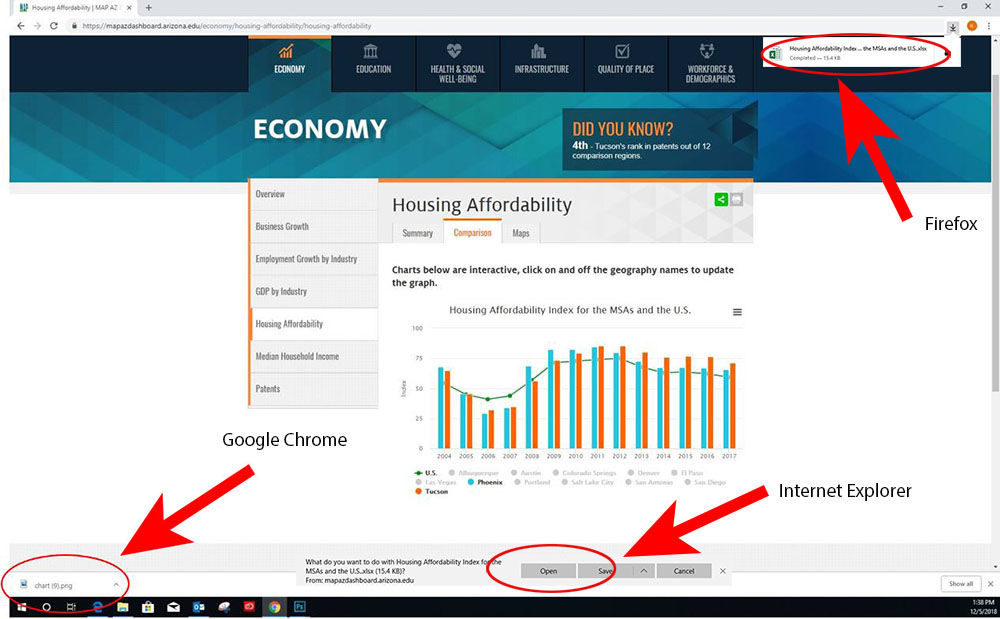
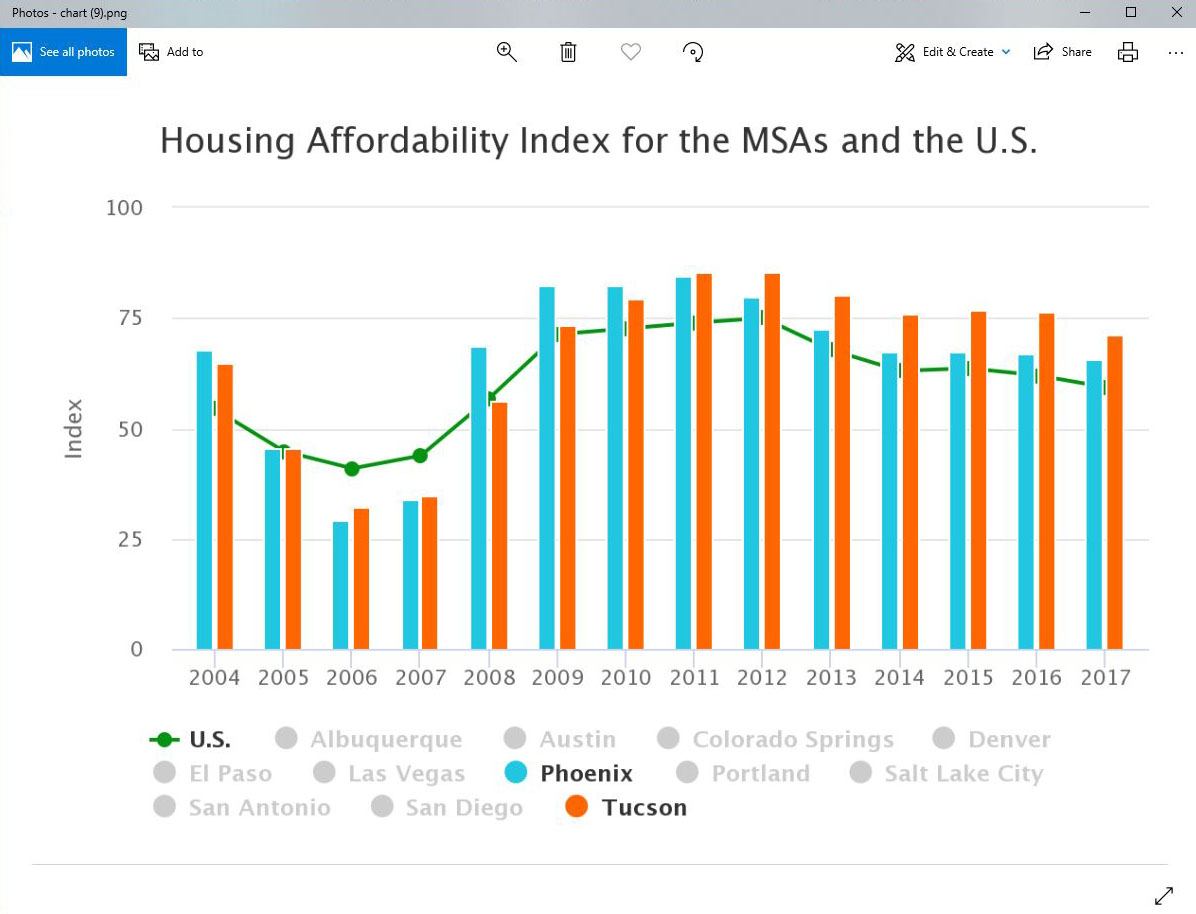
From here, you can save the downloaded PNG image. All image types work this way. Simply choose the image option from the menu and click the file that pops up on the screen to view the image and save it.
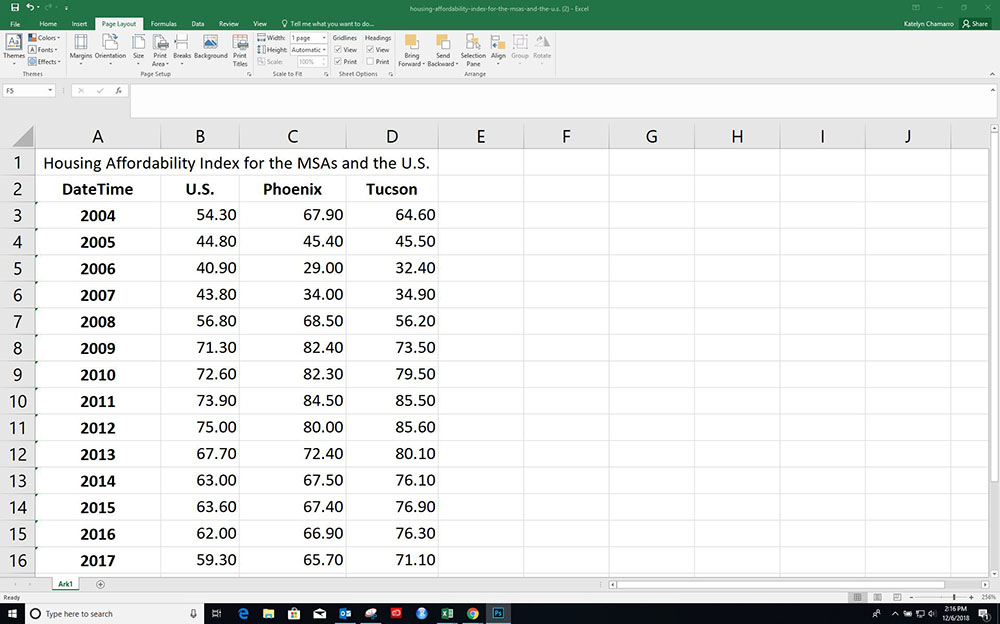
To download the data from the chart as an excel file, select “Download XLS.”
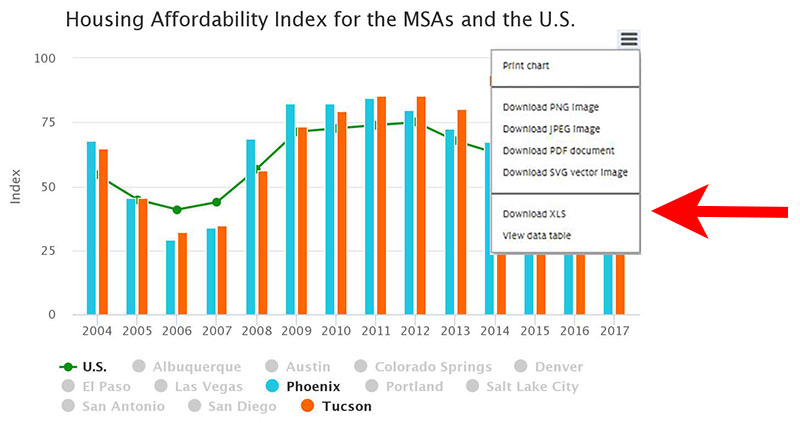
When you select the file that pops up on the screen, an excel file with the data you selected in the chart will appear.
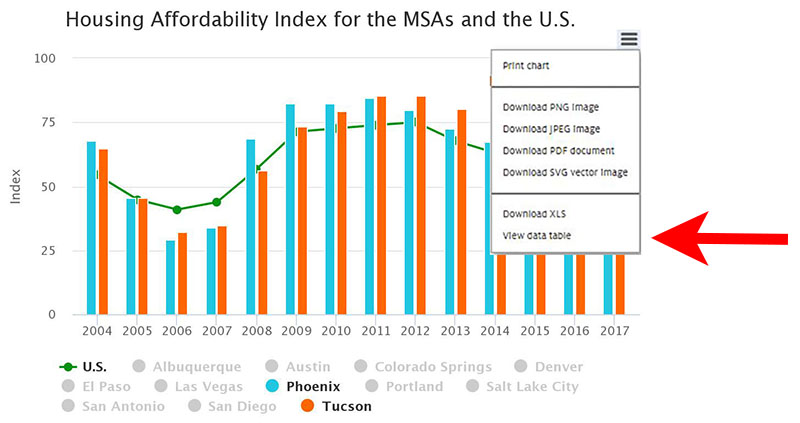
If you want to view a table of the data used in the chart, you can choose the “View data table” option.
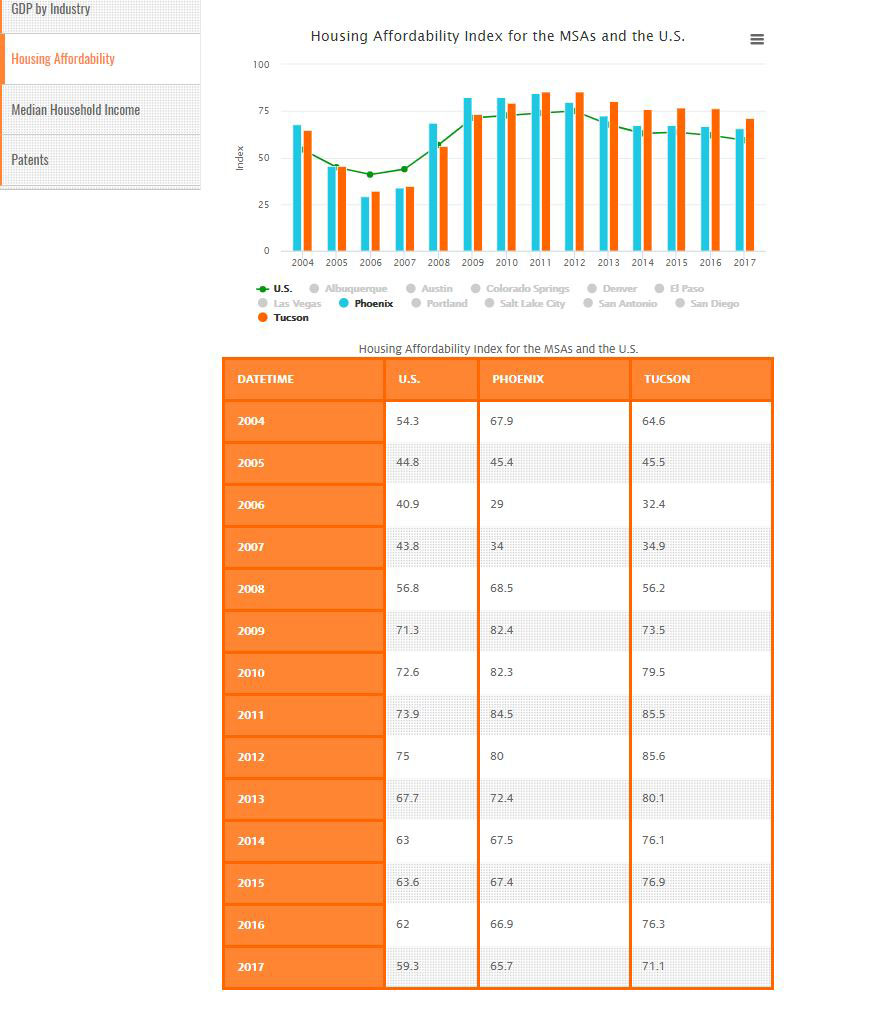
A table with the data displayed will appear on the same page.
You can follow the same steps to print, download, or view the data from any interactive chart on the dashboard. Examples of interactive charts are below.
