 Explore Statistics on Air Travel in Tucson, Arizona MSA
How are we doing?
Growth Rate in Number of Passengers (2024)
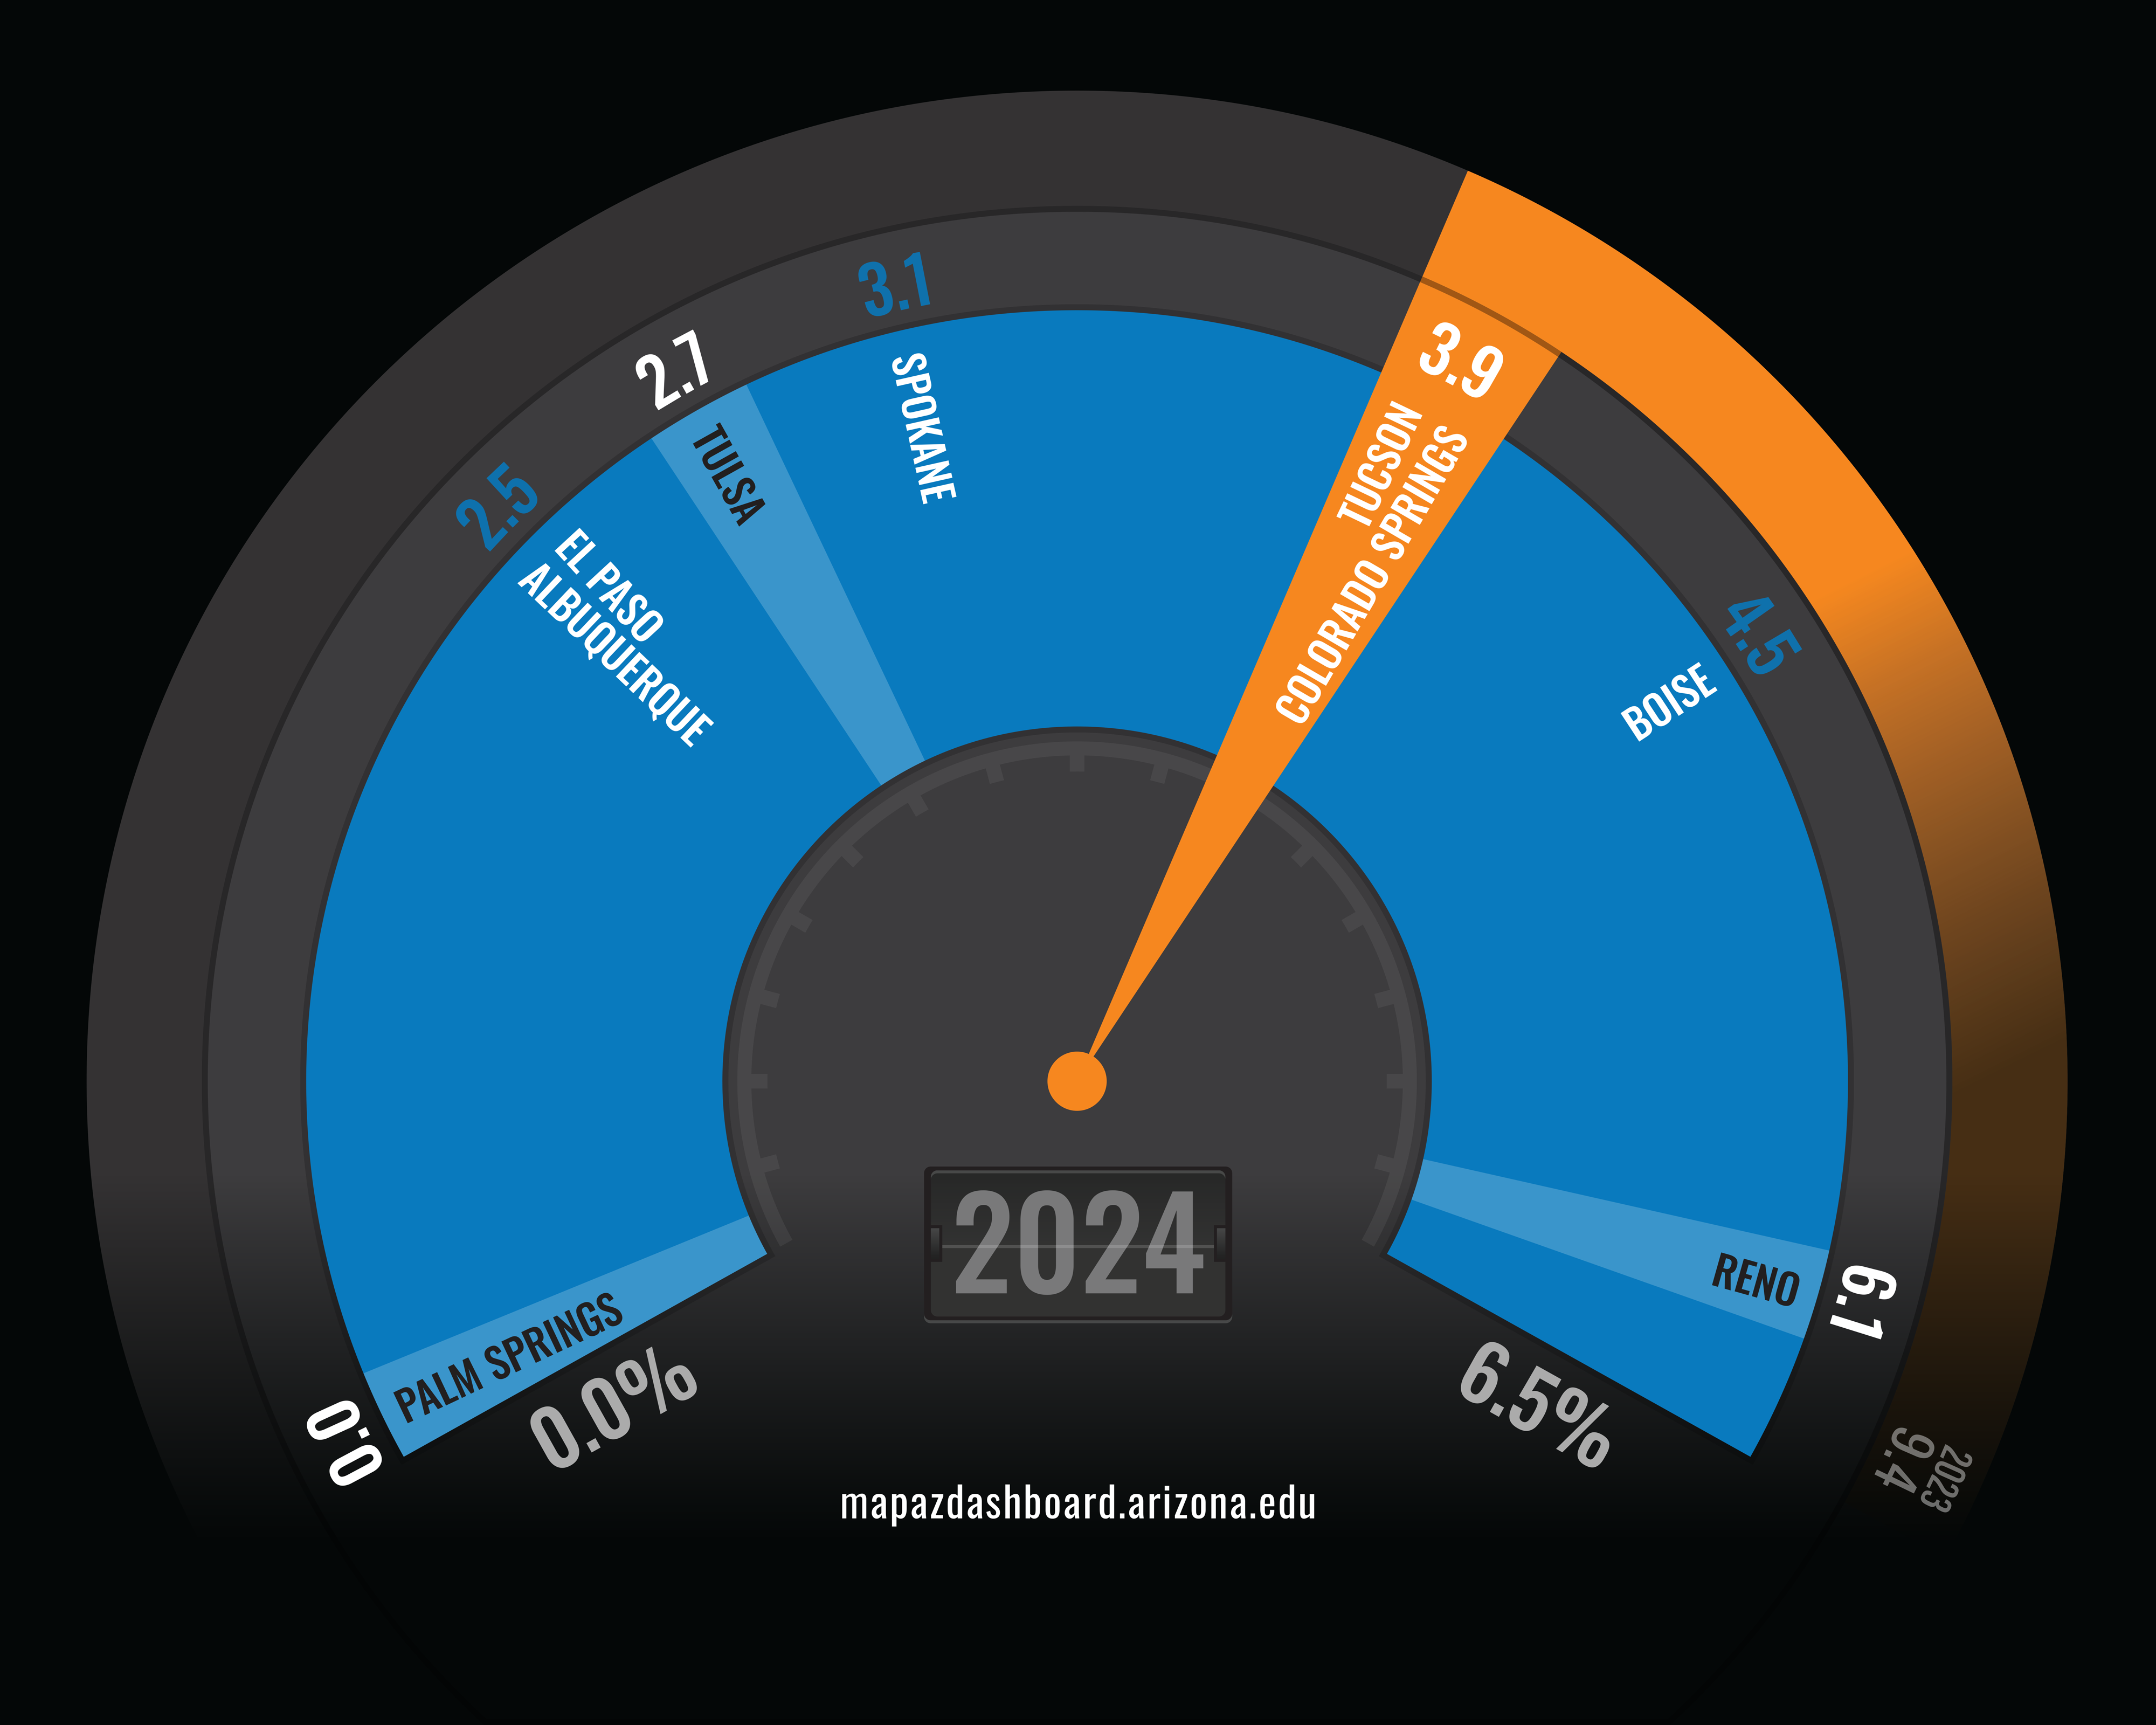
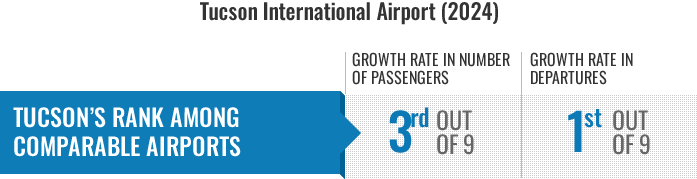
The Tucson International Airport (TIA) ranked near the top half of comparable airports with a 3.9% increase in the number of passengers in 2024. That ranked the Tucson airport third, tied with Colorado Springs. The Tucson airport serviced 3,817,659 passengers in 2024, which brought the total number of passengers traveling through the airport above pre-pandemic levels.
Generally, on the MAP Dashboard, we compare the Tucson MSA to a select group of peer metros. Due to the nature of air travel, we have included a unique group of comparison geographies for the Tucson airport, in addition to the core MAP metros. These comparison airports include non-hub airports from similar-sized regions that often have a larger hub airport nearby.
Why is it important?
Annual passenger counts and departures per day are important determinants of an airport’s financial health, regional economic impact, and availability of air transportation offered. The number of passengers and departures at non-hub airports is driven by local demand and competing airports in the same region. In contrast, airline route planning is an important factor in the number of passengers and departures at hub airports.
How do we compare?
The graphs below highlight the core MAP Dashboard geographies and the substantial differences between hub and non-hub airports. Hub airports are not comparable to non-hub airports because they handle connecting (non-local) traffic, which can represent over half of total passengers. Therefore, hub and non-hub airports are separated into two graphs.
Exploring the MAP core geographies that include non-hub airports, San Diego posted the largest increase in passengers in 2024 at 4.7%. The Phoenix-Mesa (AZA) airport posted the slowest growth in passengers during 2024 at less than 1.0%. The Phoenix-Mesa airport is a small airport primarily serviced by one airline (Allegiant) and is only included due to its proximity to Tucson. However, it is not considered a comparable airport from an economic standpoint.
When exploring MAP geographies that include hub airports, Phoenix Sky Harbor was the top-ranking with a growth rate of 7.4% in passengers in 2024, while Las Vegas posted the slowest growth. Hub airports have a considerably higher number of passengers to accommodate connecting passengers.
In 2024, the Tucson airport had an average of 53.8 departures per day. That was an increase of 13.1%. The Tucson airport ranked first among comparable airports with the fastest growth in departures. Palm Springs posted a decline in departures of -0.8%.
The graphs below explore the growth rate in the number of departures for the Tucson airport and its comparable regions. We have also included the data for the MAP geographies separated by hub and non-hub airports. Select the drop-down menu to explore the different graphs.
What are the key trends?
The Tucson airport posted an increase of 3.9% in the number of passengers in 2024. Prior to the pandemic, the growth in the number of passengers for the Tucson airport held steady near 5.0%. Airports were hit substantially hard during the pandemic and posted significant losses in the number of passengers traveling. Air travel has since rebounded nationwide. The number of passengers traveling through the Tucson airport increased by 60.8% in 2021 and 27.3% in 2022. The growth following the pandemic has brought air travel back to its pre-pandemic levels. We have also included the data for the MAP geographies separated by hub and non-hub airports. Select the drop-down menu to explore the different graphs.
How is it measured?
The number of passengers represents the total number of scheduled inbound and outbound passengers traveling through an airport each year. Departures are the daily number of flights taking off from an airport. The data comes from Airline Data Inc. and is provided to the MAP Dashboard by the Tucson Airport Authority. The airport data is revised frequently. The data provided here is current as of March 2025.


