 Analyze Occupational Wage Data in Tucson, Arizona MSA
How are we doing?
Median Wage for All Occupations (2024)

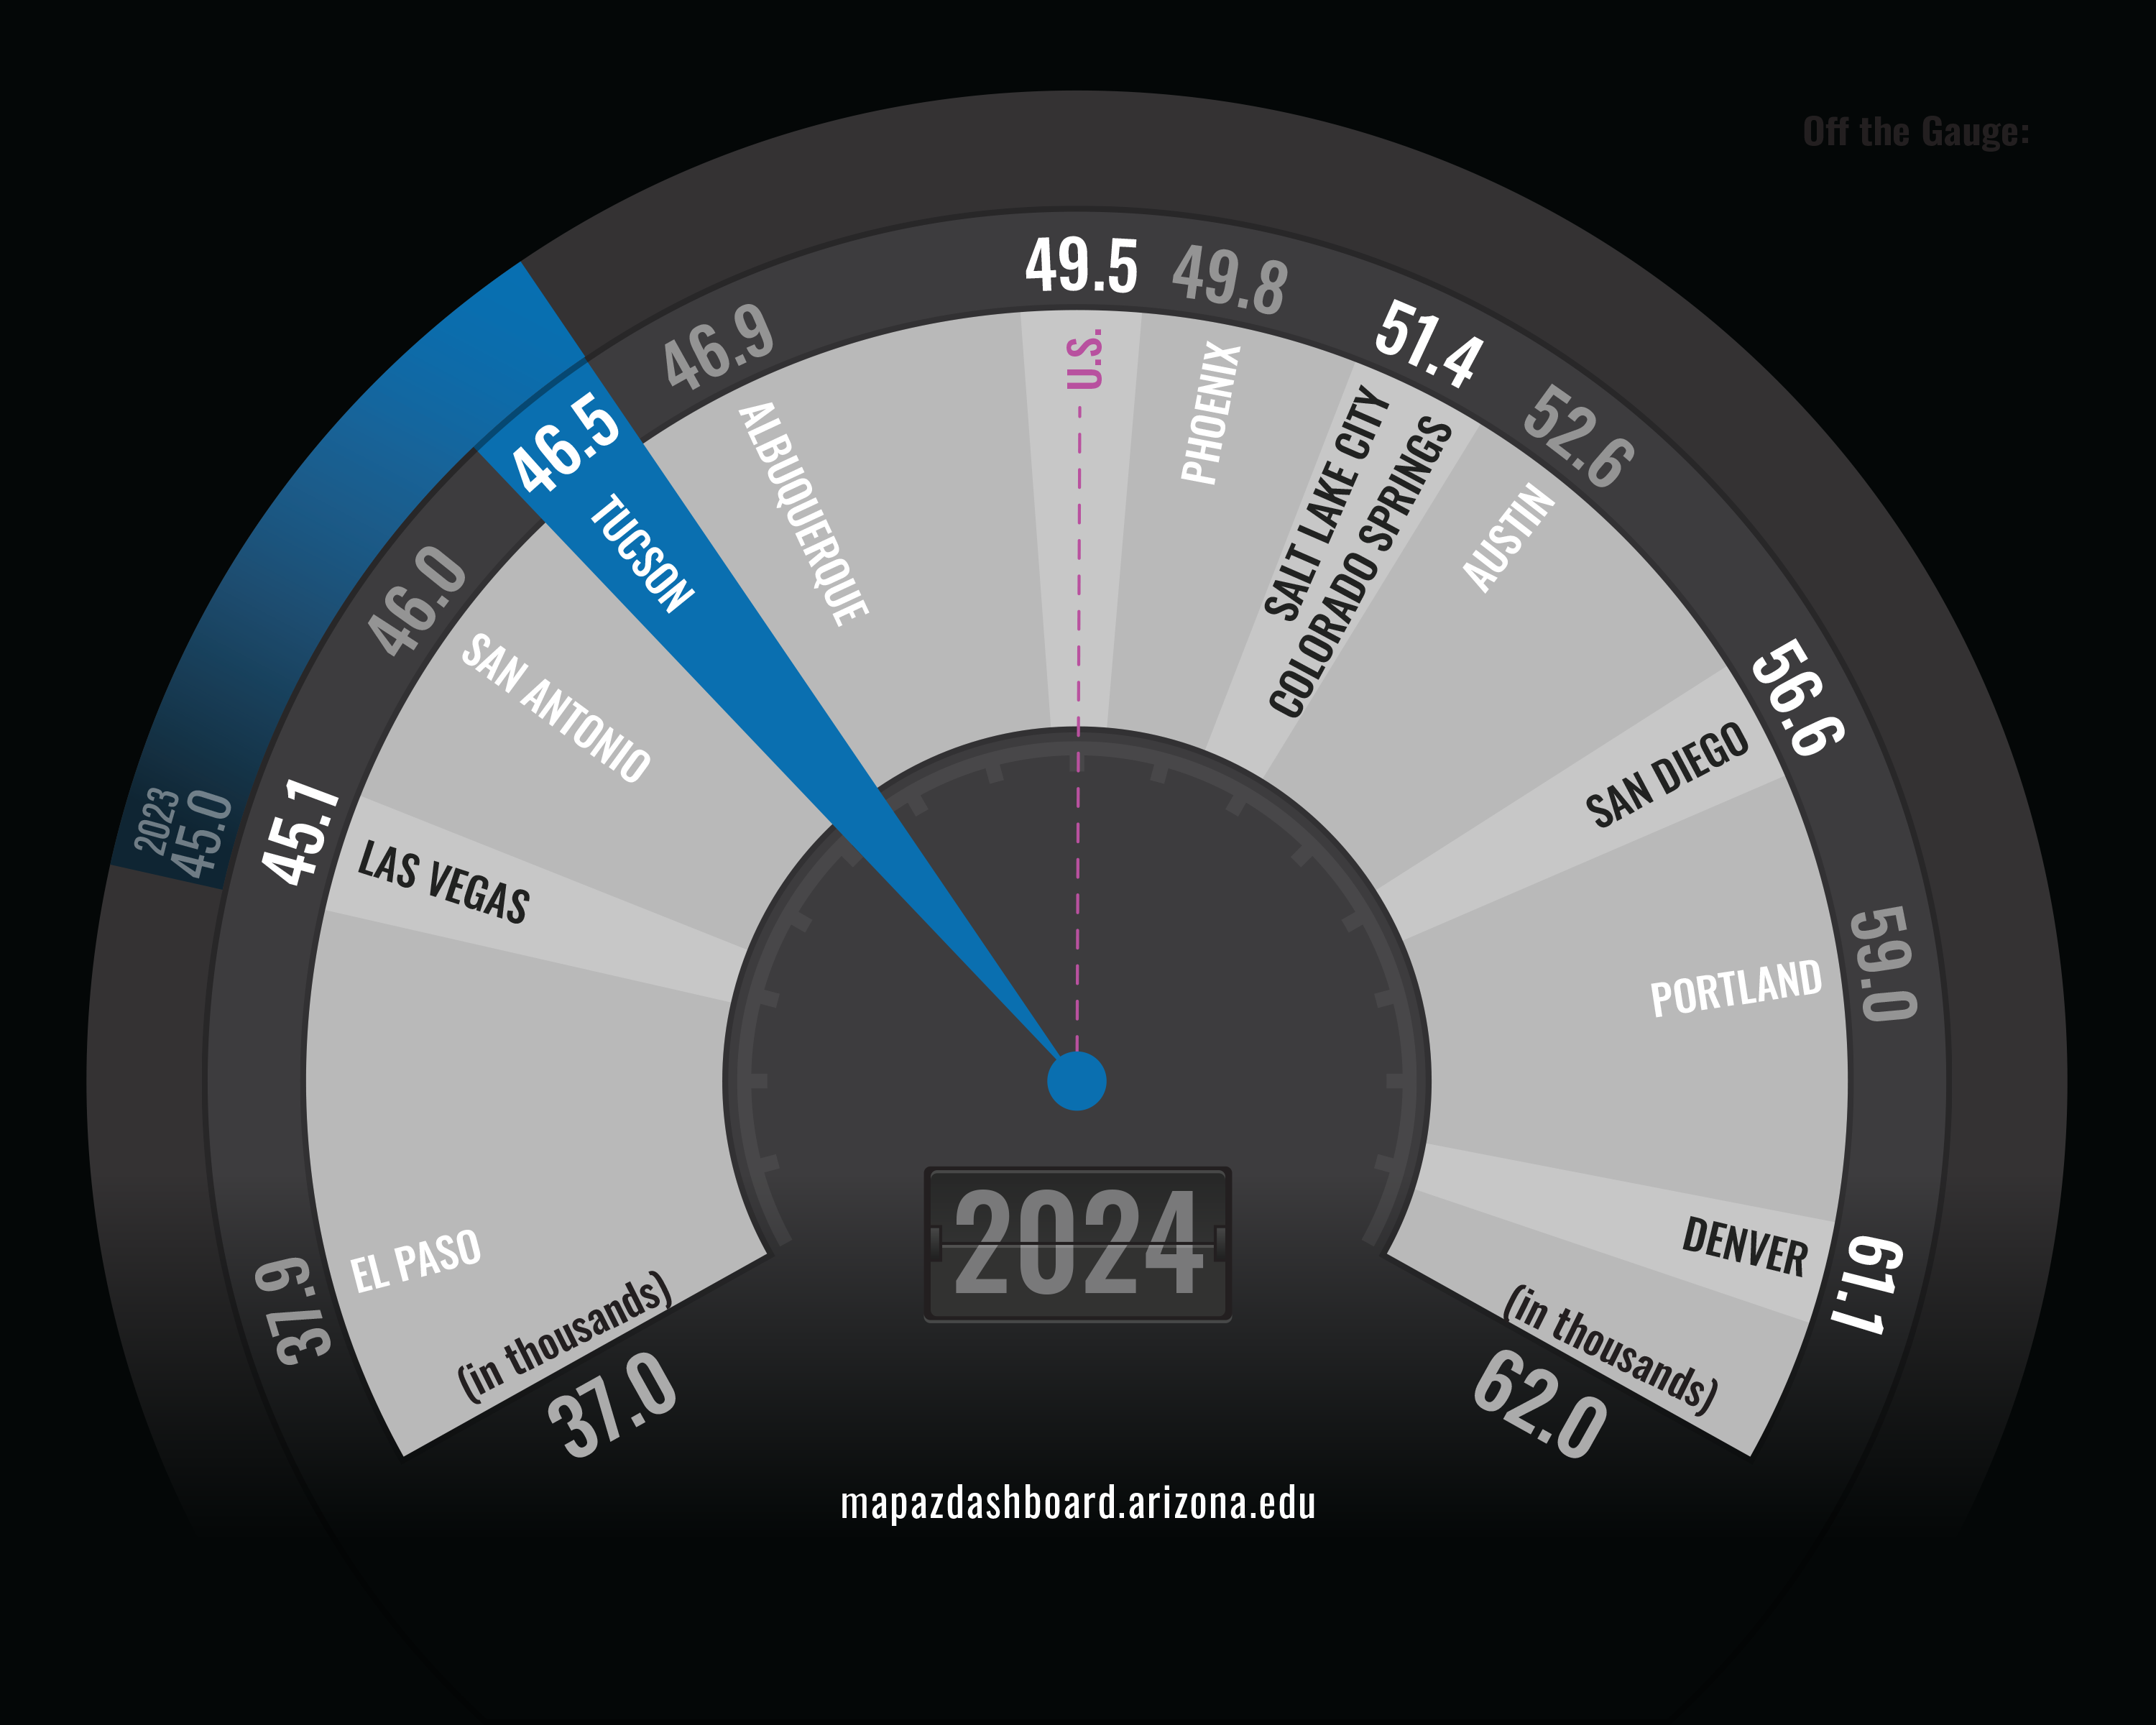
Tucson’s median wage for all occupations was $46,450 in 2024, which ranked ninth among the peer western Metropolitan Statistical Areas (MSAs). Tucson’s median wage was $3,050 below the U.S. median, an improvement from 2021 when it was nearly $8,000 lower. Denver posted the highest wage among Tucson’s peer MSAs at $61,110. Management occupations had the highest median wage in Tucson, at $100,550, while food preparation and serving occupations had the lowest, at $33,900. Wages in Tucson picked up significantly in 2022 and 2023, increasing by 11.5% and 6.0% respectively. Tucson’s wage growth returned to a modest rate of 3.2% in 2024.
Why is it important?
Occupational wages tell workers which occupations provide the largest payoff, which can influence employee residential location decisions, as well as educational choices. Wages also provide firms with important (although incomplete) information regarding labor costs. That can influence firm location choices, as well as decisions regarding workflow and organization.
How do we compare?
The five highest-paying occupations in the Tucson MSA in 2024 were management, architecture and engineering, computer and mathematical, legal, and health care practitioners. The five lowest-paying occupations were healthcare support, building and grounds cleaning and maintenance, sales and related, personal care and service, and food preparation and serving occupations. The occupational wage gap between Tucson and the U.S. is generally much larger for the higher-paying occupations than for the lowest, with the notable exception of the architecture and engineering occupations, where Tucson’s median wage was $3,000 higher.
What are the key trends?
Since 2001, the median wage in the Tucson MSA has increased at an average annual rate of 2.9% per year, slightly faster than the national growth rate of 2.7% per year. However, since 2009 (the end of the last recession), Tucson’s median wage has risen slowly, at just 1.9% per year through 2020. In 2021, the median wage in Arizona and Tucson declined by approximately 2.0% from 2020, while the nation’s median wage increased by a whopping 9.1%. Tucson’s decline in median wages was driven in part by a 9.0% drop in the median wage for management occupations, as well as those in the arts, design, entertainment, sports, and media occupations. However, wages rose substantially in 2022 and 2023 for Tucson and Arizona, increasing by 11.5% and 14.7% in 2022 and 6.0% and 5.3% in 2023, respectively. That moved wages in Tucson and Arizona closer to the national median. Tucson’s wage growth in 2024 of 3.2% was in line with the average growth posted over the past two decades of 2.9%.
How is it measured?
Occupational wages are reported as pre-tax earnings and exclude fringe benefits. The U.S. Bureau of Labor Statistics collects survey data on wages by occupation and industry and reports this data annually as Occupational Employment and Wage Statistics (OEWS). The OEWS data include detailed employment and wage estimates for over 800 occupations and industries. The median wage identifies the midpoint of the wage distribution, with half of the workers earning wages above the median and half earning wages below the median.


