 Analyze Statistics on Commuting Trends in Tucson, Arizona MSA
How are we doing?
Annual Congestion Costs per Auto Commuter (2024)
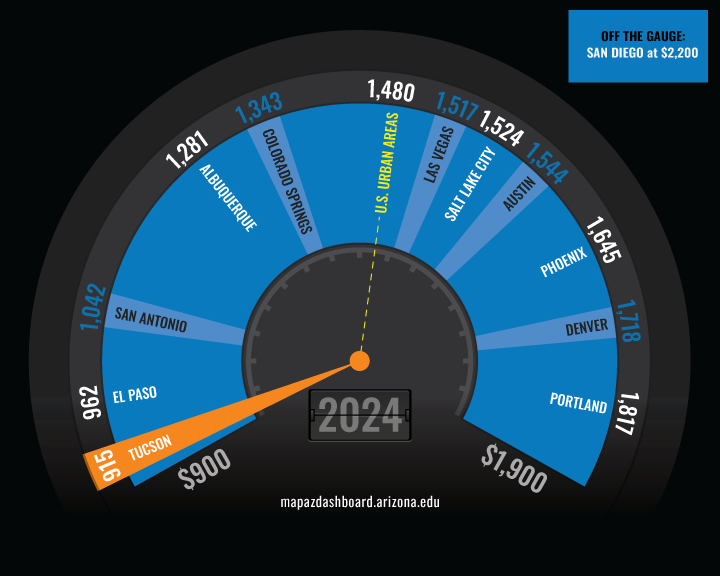
The Tucson urban area had the lowest congestion cost per commuter compared to peer urban areas in 2024 at $915. The San Diego urban area had the highest congestion cost per commuter at $2,200, about 2.4 times the cost in Tucson. Congestion costs per commuter for the Tucson urban area decreased between 2023 and 2024 by $19 (from $934 to $915). That decrease reflects a small reduction in the combined factors that drive congestion costs, including travel delay and fuel consumption. Tucson's congestion costs in 2024 are below pre-pandemic levels. Congestion costs are comprised of two components: the value of the extra travel time (delay) and excess fuel consumed by vehicles traveling at slower speeds. Congestion costs vary significantly from other congestion indicators, like delay hours, due to price variations in fuel across states. For example, in 2024 the average state fuel cost in Arizona was $4.13, while in California it was $5.46. The value of time in 2024 was consistent across all urban areas at $24.01.
The MAP Dashboard typically reports data for the Metropolitan Statistical Area. However, traffic congestion data is only available at the urban area level. Urban areas are located within a metropolitan region and have a population density of more than 1,000 persons per square mile. They are typically smaller than the metropolitan region which is comprised of counties. The geographic outline for each urban area reported here can be found in the Urban Mobility Report.
Why is it important?
The length of time it takes a commuter to get to work has an impact on one's quality of life and a region's economic well-being. Long commute times and congestion have a direct impact on the costs associated with getting to work and the value of one's time. According to the Texas A&M Transportation Institute (TTI), the nationwide cost of traffic congestion in 2024 was approximately $269 billion, and U.S. commuters lost an average of 63 hours per commuter due to delays; the equivalent of nearly eight full workweeks spent traveling because of congestion. Americans spent more time stuck in traffic in 2024 than ever before, and congestion costs have increased in recent years as travel patterns continue to change.
How do we compare?
Annual delay per auto commuter is the extra time (in hours) spent traveling at less than free-flow speeds by private vehicle drivers and passengers in typical peak periods. A commuter is considered one of these "peak-period travelers" and makes a trip between 6 - 10 a.m. or 3 - 7 p.m. Delays can be caused by bad weather, traffic accidents, or road construction.
In 2024, the Tucson urban area had the fourth-lowest number of delay hours per commuter, at 50. The El Paso urban area experienced the lowest delay, with 35 hours per commuter. The San Diego urban area reported the highest number of delay hours per commuter, at 88. Overall, U.S. urban areas averaged 63 annual delay hours per commuter. Among the urban areas explored on the MAP, slightly more than half had fewer delay hours than the national average. The additional delay hours result in excess fuel costs. The 50 hours of delay in the Tucson urban area resulted in an additional 14 gallons of gasoline for each auto commuter. The trend for excess fuel consumption can be found on the Congestion Trends comparison page.
The number of auto commuters in the Tucson urban area increased substantially through the early 2000s, broadly mirroring national trends. Between 1994 and 2004, the number of auto commuters grew by 30.1% bringing the total to 333,000. Growth continued between 2004 and 2014, with Tucson adding 27.9% more auto commuters, while auto commuting in the U.S. increased by a much faster 52.8% over the same period. By the mid-2010s, this long-term growth trend began to shift. Between 2014 and 2024, the number of auto commuters declined by 4.5%, driven largely by pandemic-related disruptions to commuting patterns. Similar trends were observed across peer urban areas. As of 2024, auto commuting in the Tucson urban area remained below its pre-pandemic peak.
What are the key trends?
The overall trend in congestion, measured by delay, increased steadily between 1984 and 2019 across U.S. urban areas, Phoenix, and Tucson. During the first year of the pandemic, congestion declined sharply as many individuals worked from home, significantly reducing commuting traffic. Post-pandemic, urban areas experienced a rapid rebound in traffic congestion. At the national level, congestion in U.S. urban areas has now exceeded its pre-pandemic level, while Phoenix has surpassed its pre-pandemic delay by 15 hours. Tucson has returned to approximately its pre-pandemic level of congestion.
How is it measured?
Traffic congestion data comes from the 2025 Urban Mobility Report. The report was published by the Texas A&M Transportation Institute and is sponsored by the Texas Department of Transportation. The 2025 report uses crowdsourced data from INRIX on urban streets and highways along with highway inventory data from a Federal Highway Administration database. This report provides congestion estimates for 494 U.S. urban areas. Some known criticisms of the Urban Mobility Report include the lack of peer review, the definition of “congestion” as less than free-flow speeds, and the focus on mobility rather than access. INRIX also produces an annual Global Traffic Scorecard.


