 Price Hikes and Electricity Cost in Arizona, USA
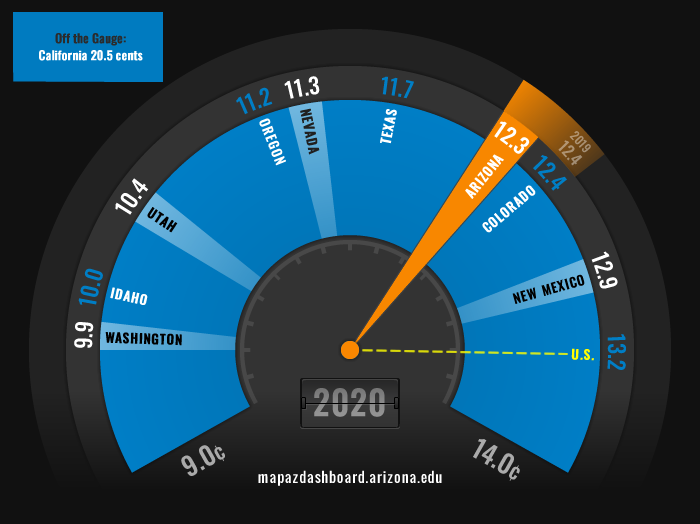
We know that prices have increased over the last year. We have felt it in our pocketbooks at the grocery store, the lumber yard, and when car shopping. You may have even noticed it when you paid your utility bills. According to data released by the Bureau of Labor Statistics from the Consumer Price Index (CPI) program, electricity prices were up by over 6% in 2021. The MAP Dashboard tracks the annual electricity price by state and utility as part of its Energy Use core indicator. The latest data available from the U.S. Energy Information Administration (EIA) placed Arizona with the fourth-highest price among the western states in 2020 (Figure 1). Arizona’s average electricity price of 12.3 cents per kilowatt-hour (kWh) in 2020 declined slightly from 2019.
Figure 1: Average Residential Electricity Price per kWh (2020)
Electricity use accounts for a large share of household spending. The price households pay for electricity can vary across providers despite the government regulation imposed on utility companies. Utilities are considered a natural monopoly, and therefore they are subject to government regulation. This regulation serves to ensure that service is adequate, companies are responsive, prices are fair, and utility providers stick to strict safety standards. Despite the government regulation, the price of electricity varies widely due to variations in operating costs, time-of-day pricing, and consumer charges.
The recently released CPI data suggests that we should expect an increase in utility prices when the 2021 EIA data are available. In addition to the annual data released by the EIA, they also report monthly data for the states. October 2021 data are the latest available as of this writing. Arizona’s average utility price increased from 9.2 cents per kWh in October of 2005 to 12.8 cents per kWh in October of 2021 (Figure 2). That is an increase of 39.0%. Arizona fared relatively well during this period when compared with other western states, like California, Oregon, and Idaho, which all posted increases of over 60%. Arizona’s average monthly electricity price of 12.8 kWh in October of 2021 is high compared to previous years but is still slightly lower than in October of 2018 when the price was 13.2 cents per kWh.
Figure 2: Average Residential Electricity Price in October (2005 – 2021)
Arizona’s average year-over-year growth in October between 2005 and 2021 was 2.1%. That was consistent with the U.S.’s year-over-year growth in the average electricity price of 2.4%. During those sixteen years, California’s year-over-year growth in October was the fastest at 4.9%, while Texas posted the slowest year-over-year growth at 0.7%.
During 2021, electricity prices increased substantially for the U.S. and many of the western states. Between October 2020 and October 2021, Arizona’s average electricity price increased by 6.0% (Figure 3). That placed Arizona with the third-largest increase (tied with Texas) among the western states, with Colorado’s average electricity price growing the fastest at 11.1% and Oregon reporting the slowest growth in electricity prices at 2.8%.
Figure 3: Year-Over-Year Percent Change in Average Residential Electricity Price, October 2020 – October 2021
We know that Arizona has a relatively high cost per kWh for electricity compared to other western states, but what does that mean for our pocketbook? Your electricity bill is determined by how much you pay for electricity and how much electricity you consume. Consumption rates vary significantly among the western states and mostly depend on the weather in your region and your personal temperature preferences. In 2020, Texas residents consumed the most electricity, with the average monthly consumption per customer at 1,132 kWh. Arizona’s rate was the second-highest at 1,114 kWh. The U.S. average monthly consumption was 893 kWh, while Californians consumed the least at 572 kWh. The amount of electricity consumed by Arizonans increased by 9.8% between October 2019 and October 2020. That is a substantial increase as consumption rates varied by only a small percentage (typically less than 1%) during the previous five years. The large increase in 2020 may be due to several factors like increases in population, changing weather patterns (i.e. warmer summers), and that more individuals worked from home during the pandemic.
Figure 4: Average Residential Monthly Electricity Consumption (kWh) in 2020
In 2020, Arizona had the fourth-highest electricity price per kWh and the second-highest consumption rate. What does that mean for the average bill in Arizona? In 2020, the average monthly electricity bill in Arizona was $136.70 (Figure 5). That was the highest among all the western states. Texas followed closely behind with an average monthly electric bill of $132.59, while Utah had an average monthly electric bill of $80.24. Arizona’s relatively high electricity bills are due to the high levels of electricity consumption coupled with a higher than average price per kWh.
Figure 5: Average Residential Monthly Bill (2020)
Arizona’s warm and sunny climate contributes to the region’s high level of electricity consumption. One way that customers can offset their electricity costs is through net metering. Net metering allows customers to generate electricity through means such as solar. That allows customers to reduce their utility purchases and potentially sell electricity back to a utility. California, followed by Arizona, was the leader in the number of customers participating in net metering in 2019. (Figure 6). We explore detailed data on net metering by source for the western states and Arizona utility providers on the Energy Use indicator page.
Figure 6: Total Number of Customers Participating in Net Metering by State (2019)
The MAP will continue to update energy-related data as it becomes available. Rising prices are a concern for many individuals around the county. Stay tuned for additional articles on rising prices and the economic implications that may have for our region.
Note that this data comes from the U.S. Energy Information Administration (EIA) which reports data on the average price and consumption of electricity for the U.S., the states, and utility providers. The net metering data is reported to the EIA by each individual utility, which the EIA compiles and publishes for the public. The EIA is a statistical and analytical agency within the U.S. Department of Energy.


