 Analyze Statistics on Energy Use in Tucson, Arizona MSA
How are we doing?
Residential Electricity Price per kWh (2024)
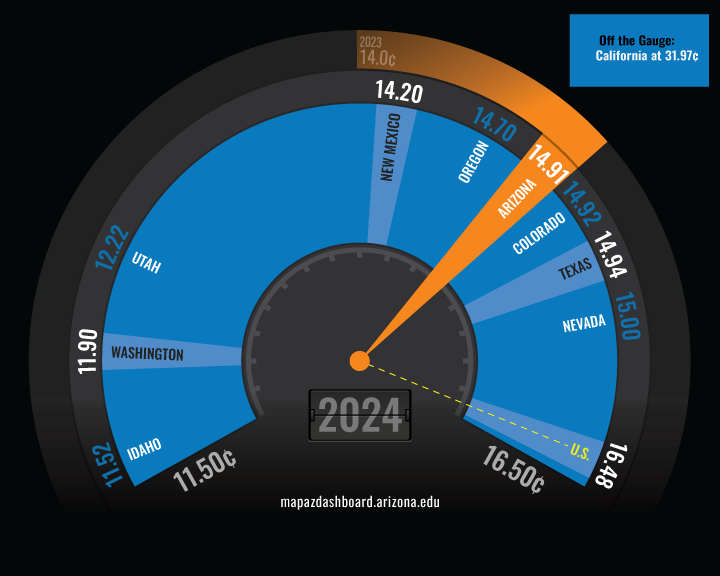
In 2024, the average price of electricity in Arizona was 14.91 cents per kilowatt-hour (kWh). Among western states, Arizona ranked fifth highest, placing it in the middle of the region’s price range. California reported the highest price by a wide margin at 31.97 cents per kWh, substantially higher than all other western states and the national average. The U.S. average of 16.48 cents per kWh was higher than every western state except California. In contrast, electricity prices in the Northwest were among the lowest, with Idaho reporting the lowest average at 11.52 cents per kWh.
Why is it important?
Electric utilities operate as natural monopolies, meaning competition and free-market entry are limited. As a result, electricity providers are regulated by government agencies to ensure reliable service, fair pricing, responsive customer service, and adherence to strict safety standards. Even with government regulation, electricity prices can vary widely due to differences in utility operating costs, fuel sources, infrastructure, and regional energy markets. In addition, pricing structures such as time-of-use rates and other consumer charges can influence what households pay.
How do we compare?
In Pima County, both Tucson Electric Power and Trico Electric Cooperative serve portions of the region and reported average electricity prices close to the statewide level. In 2024, Tucson Electric Power reported an average price of 15.6 cents per kWh, slightly above the statewide average, while Trico Electric Cooperative reported a lower average price of 14.2 cents per kWh. Electricity prices vary widely across Arizona’s utilities. In 2024, average electricity prices across Arizona utilities ranged from 9.6 cents per kWh to 29.5 cents per kWh, reflecting differences in generation sources, infrastructure, and operating costs among utilities.
Arizona ranks among the western states with one of the highest average monthly electricity bills. In 2024, the average monthly bill in Arizona was $160.20, slightly below California at $160.90 and Texas, which reported the highest average monthly bill at $163.70. Arizona’s average bill was about 12.6% higher than the national average of $142.30. By comparison, New Mexico reported the lowest average monthly electricity bill among the western states at $92.90, followed closely by Utah at $94.60.
Arizona's relatively high monthly bills reflect higher electricity consumption, particularly during the summer months when cooling needs increase electricity use. Despite higher bills, Arizona's price per kWh has increased at one of the slowest rates among western states over the past decade.
Electricity generation varies across states due to differences in available energy resources such as coal, natural gas, wind, and solar. State policies and regulations also shape each state’s energy profile. Arizona is home to the second-largest nuclear power plant (Palo Verde Nuclear Generating Station) in the United States.
In 2024, natural gas was the largest source of electricity generation in Arizona, accounting for 47.4% of total production. Nuclear power provided 28.0%, followed by renewable sources, including hydroelectric, solar, and wind, at 16.2%. Coal accounted for the remaining 8.5% of electricity generation. Compared with the nation, Arizona generated a slightly larger share of its electricity from nuclear and a smaller share from renewable sources.
Arizona's energy mix has shifted substantially over the past two decades. The share of electricity produced from coal declined from 37.9% in 2004 to 8.5% in 2024. Over the same period, natural gas generation increased significantly, while renewable sources, particularly solar and wind, increased their share of electricity production. Long-term trends in electricity production for the U.S. and western states can be explored on the comparison page.
Renewable energy has grown rapidly in Arizona’s electricity sector over the past two decades. In 2024, renewable sources accounted for 16.2% of the state's electricity generation. Solar accounted for the largest share of renewable generation at 57.3%, followed by hydroelectric at 28.3% and wind at 13.5%. Biomass, the burning of organic materials to generate electricity, accounted for 1.0% of renewable energy. Select a geography from the drop-down menu to view the generation of renewable electricity as a share of total renewables for the nation and western states. Small residual categories (e.g., “Other”) can show negative values when adjustments or facilities consume more electricity than they generate during the reporting period.
How is it measured?
The U.S. Energy Information Administration (EIA) provides data on the electricity generation and average prices for the U.S., individual states, and utility providers. The EIA serves as the statistical and analytical agency within the U.S. Department of Energy. It collects, analyzes, and publishes data that covers the full spectrum of energy production, consumption, and distribution across the nation. Electricity data is reported on both a monthly and an annual basis.
In 2024, the System Average Interruption Duration Index (SAIDI), the minutes of non-momentary electric interruptions per year that the average customer experienced, varied across the western states. Values ranged from a low of 63.8 minutes per year to a high of 164.4 minutes, indicating substantial variation in reliability. Arizona had the second-lowest outage duration among the western states, reflecting relatively strong reliability. Some western states exceeded the U.S. average of 131.6 minutes, while others were well below it. Overall, the results highlight meaningful differences in grid reliability across the western states.
In 2024, the System Average Interruption Frequency Index (SAIFI), the number of non-momentary interruptions per customer per year, varied across the western states, ranging from 0.7 to 1.4 interruptions. Arizona recorded 0.9 interruptions, ranking third lowest among the western states. Some states were above the U.S. average of 1.1, while others were below it.
In 2024, the Customer Average Interruption Duration Index (CAIDI), the average number of minutes it takes to restore non-momentary electric interruptions, varied across the western states, ranging from 79.4 minutes in Arizona to 150.6 minutes in Oregon. Arizona had the lowest outage duration, indicating faster restoration times.


