 Dive Into Data on Transportation to Work Trends in Tucson, Arizona MSA
How are we doing?
Percent of Residents Working From Home (2024)
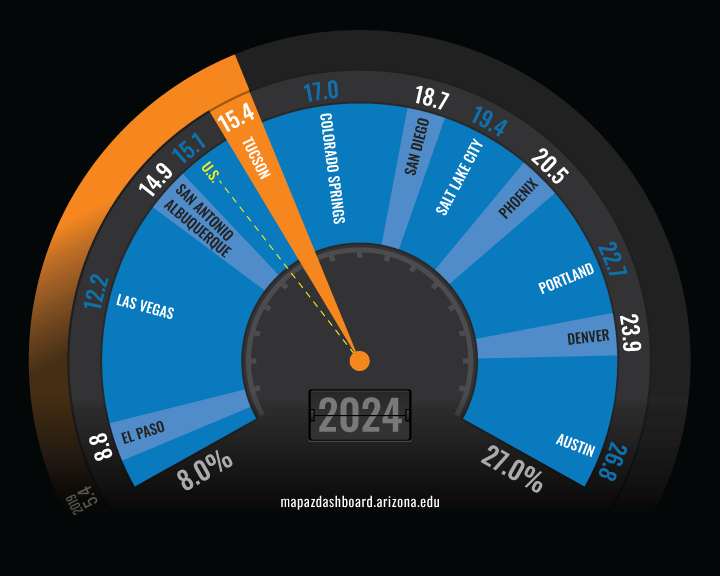
In 2024, 15.4% of employed residents in the Tucson Metropolitan Statistical Area (MSA) reported working from home, ranking Tucson eighth among peer western metropolitan areas. Remote work expanded sharply at the beginning of the pandemic, with variation across MSAs reflecting differences in industry mix and occupations. The data reported here are based on a five-year survey and therefore include the pandemic year of 2020, when stay-at-home orders were widespread across the nation.
Driving alone remains the primary mode of transportation to work in Tucson and across most of America. In 2024, 69.3% of Tucson workers drove alone to work. While still the primary mode, the share has declined from pre-pandemic levels, following nearly two decades of gradual increases. Alternative modes, including carpooling, public transit, walking, and bicycling, can reduce congestion and mitigate the impact of driving alone on roadways.
Why is it important?
The prevalence of driving alone, as the primary mode of transportation to work, has had significant economic, social, and environmental implications for our nation. To mitigate these effects, recent transportation-authorization bills have required state transportation agencies to incorporate multimodal considerations into all new transportation planning and programming, as mandated by the Intermodal Surface Transportation Equity Act of 1991. Subsequent bills have expanded existing efforts and created new programs to foster alternative transportation options and decrease highway congestion. Examples include limiting the addition of single-occupant vehicle capacity and increasing funding for public transit, bicycling, and walking facilities.
Commute patterns, both how people travel and how long it takes to get to work, reflect both quality of life and economic well-being for a region. Longer commute times often indicate a spatial mismatch between jobs and housing, which can disproportionately impact low-income households with limited mobility. Long commute times can also result from high housing costs, poorly planned transportation networks, and local regulatory policies such as exclusionary zoning.
How do we compare?
In 2024, 69.3% of Tucson residents reported driving alone as their primary means of transportation to work. Among 12 peer western MSAs tracked on the MAP Dashboard, Tucson ranked eighth. Austin posted the lowest share of commuters driving alone at 60.9%, while El Paso had the highest at 74.9%.
Bicycling accounted for 0.9% of Tucson commuters to work in 2024, exceeding both Arizona and the U.S. by 0.4 and 0.5 percentage points, respectively. Driving alone accounted for nearly 70.0% of commuters in both Tucson and the U.S, while Arizona’s share was slightly lower. The state posted a higher carpooling rate at 9.8%, above both Tucson and the U.S. Tucson and Arizona trailed the nation in walking to work, at 1.8% and 1.7%, respectively, compared to 2.4% nationally.
What are the key trends?
The share of commuters driving alone has declined across Tucson, Arizona, and the U.S. since 2019. This shift reflects the sustained increase in remote work following the pandemic.
In 2024, the mean commute time in Tucson was 24.3 minutes, down slightly from just before the pandemic and below Arizona’s statewide average of 25.4 minutes. Both Tucson and Arizona reported shorter commute times than the national average of 26.4 minutes.
How is it measured?
Transportation-to-work data are from the U.S. Census Bureau’s American Community Survey (ACS) five-year estimates. The ACS is a nationwide, rolling-sample survey that produces one-year and five-year estimates for demographic, social, housing, and economic measures. Note that the ACS five-year estimates are produced over a five-year time period and can only be compared to non-overlapping five-year estimates (for example, 2005-2009 and 2010-2014). Data used include the percentage of total travelers to work by mode of transportation (driven alone, carpooled, public transportation, walked, bicycle, taxi, or other), and commute time.


