 Analyze Housing Cost Burden Rates in Tucson, Arizona MSA
How are we doing?
Percent of Housing Cost Burdened Households (2024)
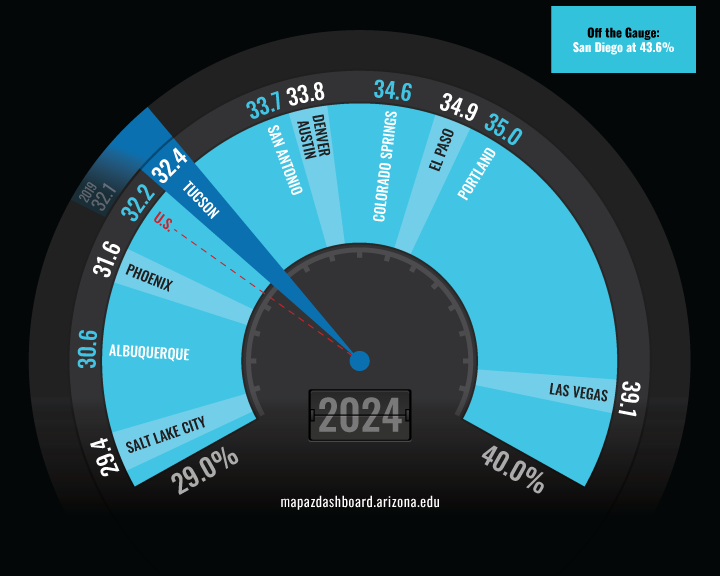
Housing cost burden varied considerably across Tucson’s peer Metropolitan Statistical Areas (MSAs) in 2024. The Tucson MSA ranked fourth lowest, with 32.4% of households paying more than 30% of their income toward housing costs. Among Tucson’s peers, housing cost-burden rates ranged from 43.6% in San Diego to 29.4% in Salt Lake City. The Tucson MSA fared reasonably well, with 32.4% of households, or 137,388 households, considered housing cost-burdened. Even so, nearly one in three households face housing affordability challenges. Renters consistently pay a larger share of their income in housing costs than homeowners in Tucson, Arizona, and nationally. Further, renters have seen a rising share of their income devoted to housing costs since 2000. This underscores the growing strain on lower and moderate-income households.
Why is it important?
Households that spend more than 30% of their income on housing-related expenditures, including utilities, are considered cost-burdened. This designation dates back to the United States National Housing Act of 1937 and has long served as the standard measure of housing affordability. Households that exceed this threshold often face difficult trade-offs. When households are cost-burdened, they are more likely to struggle with other essential expenses, including healthcare, childcare, transportation, and even food.
How do we compare?
Housing cost burden differs considerably by tenure. Renters are significantly more likely than homeowners to spend more than 30% of their income on housing. In the Tucson MSA in 2024, 22.0% of owners were cost-burdened compared to 53.2% of renters. This difference was consistent with trends seen at both the state and the national levels.
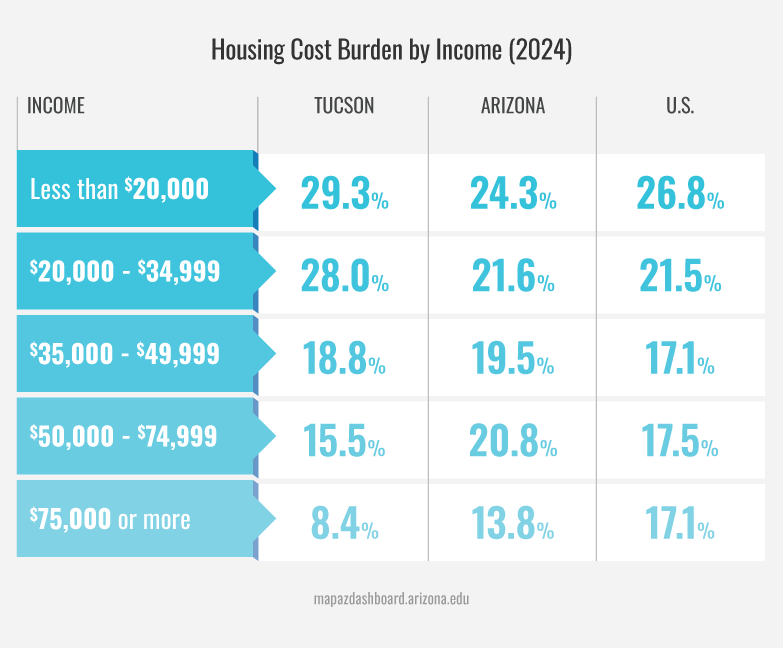
Income is a key driver of housing cost burden. Households with lower incomes are far more likely to spend more than 30% of their income on housing. In Tucson, 29.3% of households earning less than $20,000 were considered housing cost burdened. This was notably higher than the rate for households in the same income bracket in the state (24.3%) and the nation (26.8%). At the higher income levels, the likelihood of being cost-burdened declines substantially. Among households earning $75,000 or more in Tucson, 8.4% were housing cost burdened. That compares to 13.8% for the state and 17.1% nationally (more than double the Tucson rate). These differences underscore the disparities faced by the region’s lowest-income households, while highlighting Tucson’s relatively lower cost burden among higher-income households compared to the state and nation.
In 2024, those aged 25 to 34 had the highest housing cost burden rate in the Tucson MSA at 25.8%, followed by those aged 65 and older at 23.2%. Compared to Tucson, the U.S. had higher housing cost burden rates than Tucson for the 35 to 64-year-olds and those 65 and older. Among peer MSAs, Tucson had one of the lowest rates for households age 65 and older, suggesting relatively less housing cost pressure locally than in comparable regions.
What are the key trends?
Between 2000 and 2009, the share of renter households that were housing cost-burdened increased sharply in Tucson, Arizona, and the U.S. Housing cost-burden rates for renters eased a bit between 2014 and 2019 across all three geographies, reflecting a period of increased stability in affordability for both renters and homeowners. However, by 2024, the renter cost burden in Tucson had increased to a nearly 25-year high. Over the past two decades, Tucson has consistently recorded higher housing cost burden rates for renters than both the state and the nation. This highlights the systematic affordability challenges facing renter households in Tucson. Housing cost burden rates among homeowners in Tucson have fallen by more than four percentage points since 2009.
How is it measured?
Housing cost burden data are reported separately for homeowners with a mortgage, homeowners without a mortgage, and renters. Households are considered housing cost burden if they spend more than 30% of their income on housing costs, including utilities. Housing cost burden data are from the Census Bureau’s American Community Survey (ACS). (ACS). The ACS is a nationwide rolling sample survey that produces one-year and five-year estimates on demographic, social, housing, and economic measures. All data provided in this analysis utilized five-year estimates. Note that the ACS five-year estimates are produced over a five-year period and can only be compared with non-overlapping five-year estimates (for example, 2006-2010 and 2011-2015).


