 Learn About Employment Growth by Industry in Tucson, Arizona MSA
How are we doing?
Growth Rate of Total Nonfarm Employment (2025)
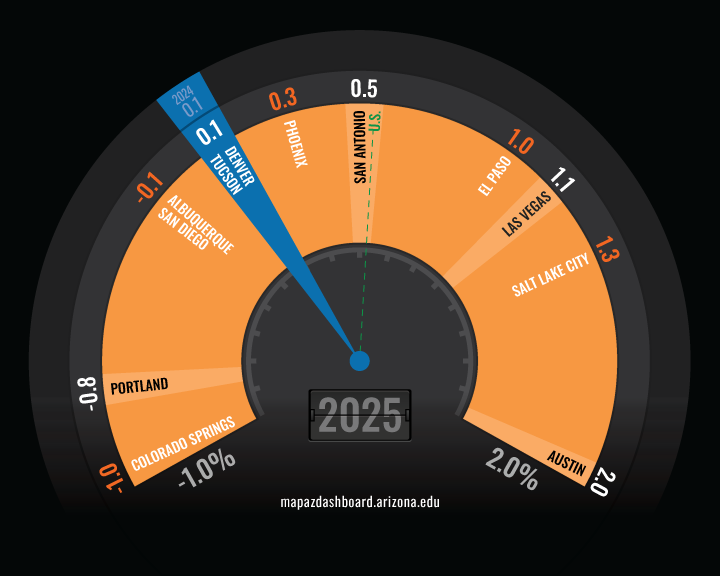
In 2025, total nonfarm employment for the Tucson Metropolitan Statistical Area (MSA) increased by 0.1%, matching the revised 0.1% growth reported for 2024. This reflects limited net job growth over the past two years. The number of non-farm jobs in Tucson has remained steady at 404,000 since 2023. Job growth was also slow nationally and across the state, while employment in Phoenix increased by a very modest 0.3%, only slightly outpacing Tucson. Among peer western MSAs, Tucson ranked seventh, tied with Denver. Austin posted the fastest employment growth at 2.0%, followed by Salt Lake City at 1.3%. Las Vegas, which experienced significant losses during the pandemic due to its large share of jobs in leisure & hospitality, has posted strong job growth over the past five years.
In Tucson, modest net job gains in 2025 were uneven across industries. The government sector posted the largest loss, with approximately 1,167 jobs, or 1.5%. That was followed by the trade, transportation, and utilities sector, which lost just over 800 jobs, or 1.1%. The Information sector posted the largest percentage decline at 7.6%, or a reduction of nearly 400 jobs. Other industries that posted smaller losses included professional and business services, manufacturing, and other services. The education and health services sector added the most jobs, 1,542, with a growth rate of 2.1%. The financial activities sector added 1,200 jobs with a growth rate of 6.8%. Other sectors reporting job gains included leisure and hospitality and natural resources and mining.
While job growth has been slow in the Tucson MSA over the past few years, it has also been slow nationwide and statewide. Except for a few of Tucson’s peer MSAs, the country is in a low-growth, low-layoff environment. To view the preliminary monthly job data for Tucson, visit the award-winning Arizona’s Economy online magazine or download the free Arizona’s Economy smartphone app.
Why is it important?
The rate of change in total employment is a key indicator of an economy's overall performance. Employment growth reflects a region’s ability to generate jobs, income, and economic opportunities for those living in that region. Slow job growth can put downward pressure on wages and slow overall economic growth. Employment growth, subdivided by industry, highlights the industries that make up the employment base and how that mix changes over time.
How do we compare?
Arizona’s very modest 0.1% increase in total nonfarm employment ranked third-lowest among western states. Arizona’s job gains were driven mostly by the Phoenix MSA, which posted a 0.3% increase in 2025. Oregon posted the largest decline in jobs across the western states at -0.5%, followed by Colorado at -0.3%. Idaho had the fastest growth at 1.5%.
What are the key trends?
Total employment growth in the Tucson MSA was slow to rebound from the 2008 to 2009 recession. However, employment growth in Tucson picked up in 2019 to 2.4%, the fastest growth posted since the 2008 to 2009 recession. Employment growth then declined sharply in 2020 due to the Coronavirus pandemic. Tucson’s loss of 4.4% in 2020 was slightly better than the national loss of 5.8%. In 2021, Tucson’s job growth increased by 2.2%. Tucson’s employment gains in 2022 grew even faster at 3.6%. However, that was slower than the state or the nation, despite being the fastest job growth in 16 years. In 2024 and 2025, Tucson’s growth cooled significantly, with essentially no growth.
How is it measured?
Employment by industry is estimated based on a survey of employers. It reflects the number of jobs at establishments located within an area. An individual who works at two separate establishments during a year will be counted twice. Employment data come from the Bureau of Labor Statistics Current Employment Statistics (CES). The CES collects monthly survey data on employment, hours, and earnings of workers on nonfarm payroll.


