 Analyze Youth Disconnection Rates in Tucson, Arizona MSA
How are we doing?
Youth Disconnection Rate (Ages 16–19) 2024
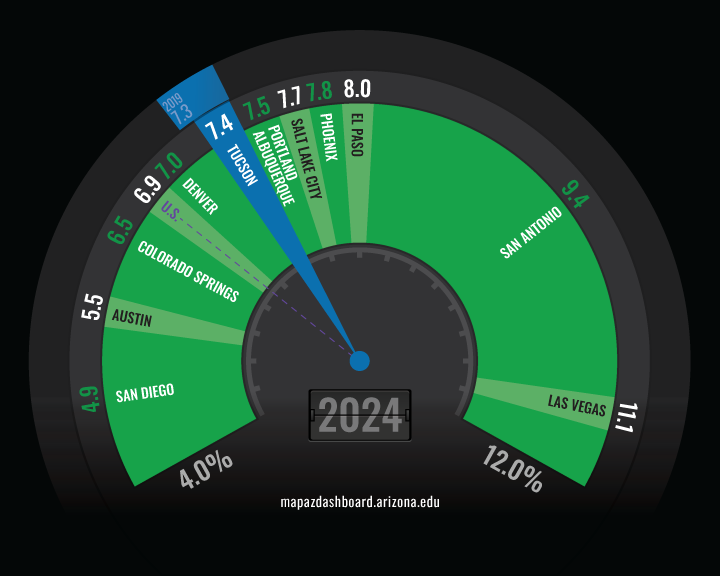
The youth disconnection rate across the 12 Metropolitan Statistical Areas (MSAs) varied widely in 2024. Tucson ranked fifth from the bottom, with 7.4% of its youth considered disconnected. Las Vegas reported the highest rate at 11.1%, while San Diego had the lowest at 4.9%. Only three MSAs reported a lower youth disconnection rate than the national average of 6.9%. In 2024, 6.9% of U.S. teenagers aged 16 to 19 were neither working nor in school, representing 1.2 million young Americans.
Disconnected youth are individuals who are not in school or employed, which includes both teenagers between the ages of 16 and 19, as well as young adults from 20 to 24. The term "opportunity youth" is frequently used as a synonym for "disconnected youth."
In 2022, youth disconnection rates among individuals ages 16–24 varied among peer MSAs. Salt Lake City had the lowest rate at 8.3%, followed closely by Denver (8.6%) and San Diego (8.7%). Tucson’s youth disconnection rate was 10.9%, slightly higher than Phoenix (10.6%). Among peer MSAs, Las Vegas had the highest youth disconnection rate at 15.6%.
Figure 1: Youth Disconnection Rates by MSAs (16-24 Years Old) 2022
Why is it important?
According to the NCES (National Center for Education Statistics), in 2022, the overall “status dropout rate” (defined as the percentage of 16- to 24-year-olds who are not enrolled in high school and lack a high school credential) for the U.S. was 5.3%. To learn more about status dropout rates, visit the MAP Dashboard core indicator High School Graduation Rates.
Being disconnected from both the education system and the job market during these formative years can be discouraging and detrimental to young adults. Newport Institute highlights the negative consequences of youth disconnection, including reduced lifetime earnings, substance use, poor health, and criminal behavior.
Youth disconnection serves as a key indicator of a community's potential and reflects the level of opportunity available to its residents. It is closely linked to the overall well-being of a region and the broader health of the national economy. An article from the Social Science Research Council highlights that disconnected youth , on average, earn $38,400 less each year than their connected counterparts when they reach their thirties, underscoring the economic impact of youth disconnection.
How do we compare?
In 2024, girls and young women in the United States continued to be less likely to be disconnected than boys and young men, with disconnection rates of 6.2% and 7.6%, respectively. New Mexico had the largest gender gap in youth disconnection rates among the western states. Arizona followed a similar pattern, with higher disconnection rates among males (8.6%) than females (7.7%).
Across peer metropolitan areas, females generally had lower disconnection rates than males, with two exceptions: the Colorado Springs and San Antonio MSAs. In both areas, females had slightly higher disconnection rates than males (by 1.4 and 0.6 percentage points, respectively). In contrast, the Albuquerque MSA exhibited the widest gender gap among peer MSAs in favor of females, with a 3.7 percentage point difference. San Diego reported the lowest disconnection rates for both males (5.1%) and females (4.6%) among the MSAs. Figure 1 displays the youth disconnection by gender (U.S., Arizona, and MSAs).
Figure 2: Youth Disconnection Rates by Gender: U.S, States, and MSAs (16-19 Years Old ) 2024
The rates of disconnected youth vary by race and ethnicity across the country. As of 2022, Native American youth had the highest disconnection rate at 21.9 percent, surpassing all other major racial and ethnic groups in the United States. Arizona reported the highest disconnection rate among young Native Americans at 27.3%, followed by New Mexico at 24.7% and California at 21.6%. Black/African American teens and young adults had the second-highest disconnection rate in the U.S. at 16.8%. Nevada had the highest rate of youth disconnection among Black/African Americans at 26.4%, while Arizona had the lowest at 14.5%.
Of all the states observed on the MAP, higher rates of youth disconnection were reported for young Hispanics and Latinos compared to white, non-Hispanic youth. In the case of the MAP western MSAs, only Las Vegas had higher rates of youth disconnection for white, non-Hispanic youth (14.3%) than for young Hispanics and Latinos (12.9%).
The state of Arizona reported the largest gap between these two groups, with a 7.0 percentage point higher disconnection rate for young Hispanics and Latinos compared to white, non-Hispanic youth. Washington posted the smallest gap, with only a 0.1 percentage point difference. Among tracked western MSAs, Denver posted the largest gap between these two groups (a 7.2 percentage point difference), and Austin had the smallest gap (a 2.4 percentage point difference). Figure 3 shows the youth disconnection rate by race (U.S., states, and MSAs).
Figure 3: Youth Disconnection Rates by Race: U.S., States, and MSAs (16-24 Years Old ) 2022
What are the key trends?
As shown in Figure 4, the disconnected youth rate declined substantially from 2009 to 2019 across the United States, all western states, and nearly all of the 12 MSAs. This period reflects broad improvements following the Great Recession, with especially large declines in states such as Arizona and Nevada. Between 2019 and 2024, however, disconnected youth rates increased in most western states and MSAs, indicating a partial reversal of earlier gains. Despite this uptick, rates in 2024 generally remained below their 2009 levels.
In Arizona, the disconnected youth rate fell from 10.3% in 2009 to 8.4% in 2019, before edging down slightly further to 8.2% in 2024. Nationally, the rate declined from 8.0% in 2009 to 6.6% in 2019, then rose modestly to 6.9% by 2024. Among western states, Nevada continued to have one of the highest disconnected youth rates in 2024 (10.3%) while Utah had the lowest rate at 6.3%. At the metropolitan level, Las Vegas experienced a notable increase from 9.5% in 2019 to 11.1% in 2024, while San Diego recorded the lowest rate among MSAs in 2024 at 4.9%. Tucson’s rate remained relatively stable over time, declining from 8.6% in 2009 to 7.3% in 2019 and increasing slightly to 7.4% in 2024.
Figure 4: Youth Disconnection Rates Trend, 16-19 Years Old (2009-2024)
How is it measured?
Youth disconnection rates are from U.S. Census Bureau American Community Survey (ACS) five-year estimates. Note that the ACS five-year estimates are produced over a five-year time period and can only be compared to non-overlapping five-year estimates (for example: 2006-2010 and 2011-2015). Youth disconnection data by race and ethnicity come from Measure of America, a project of the Social Science Research Council (SSRC).


