 Analyze Data on Creative Occupations in Tucson, Arizona MSA
How are we doing?
Creative Occupations Employment per 1,000 Residents (2025)
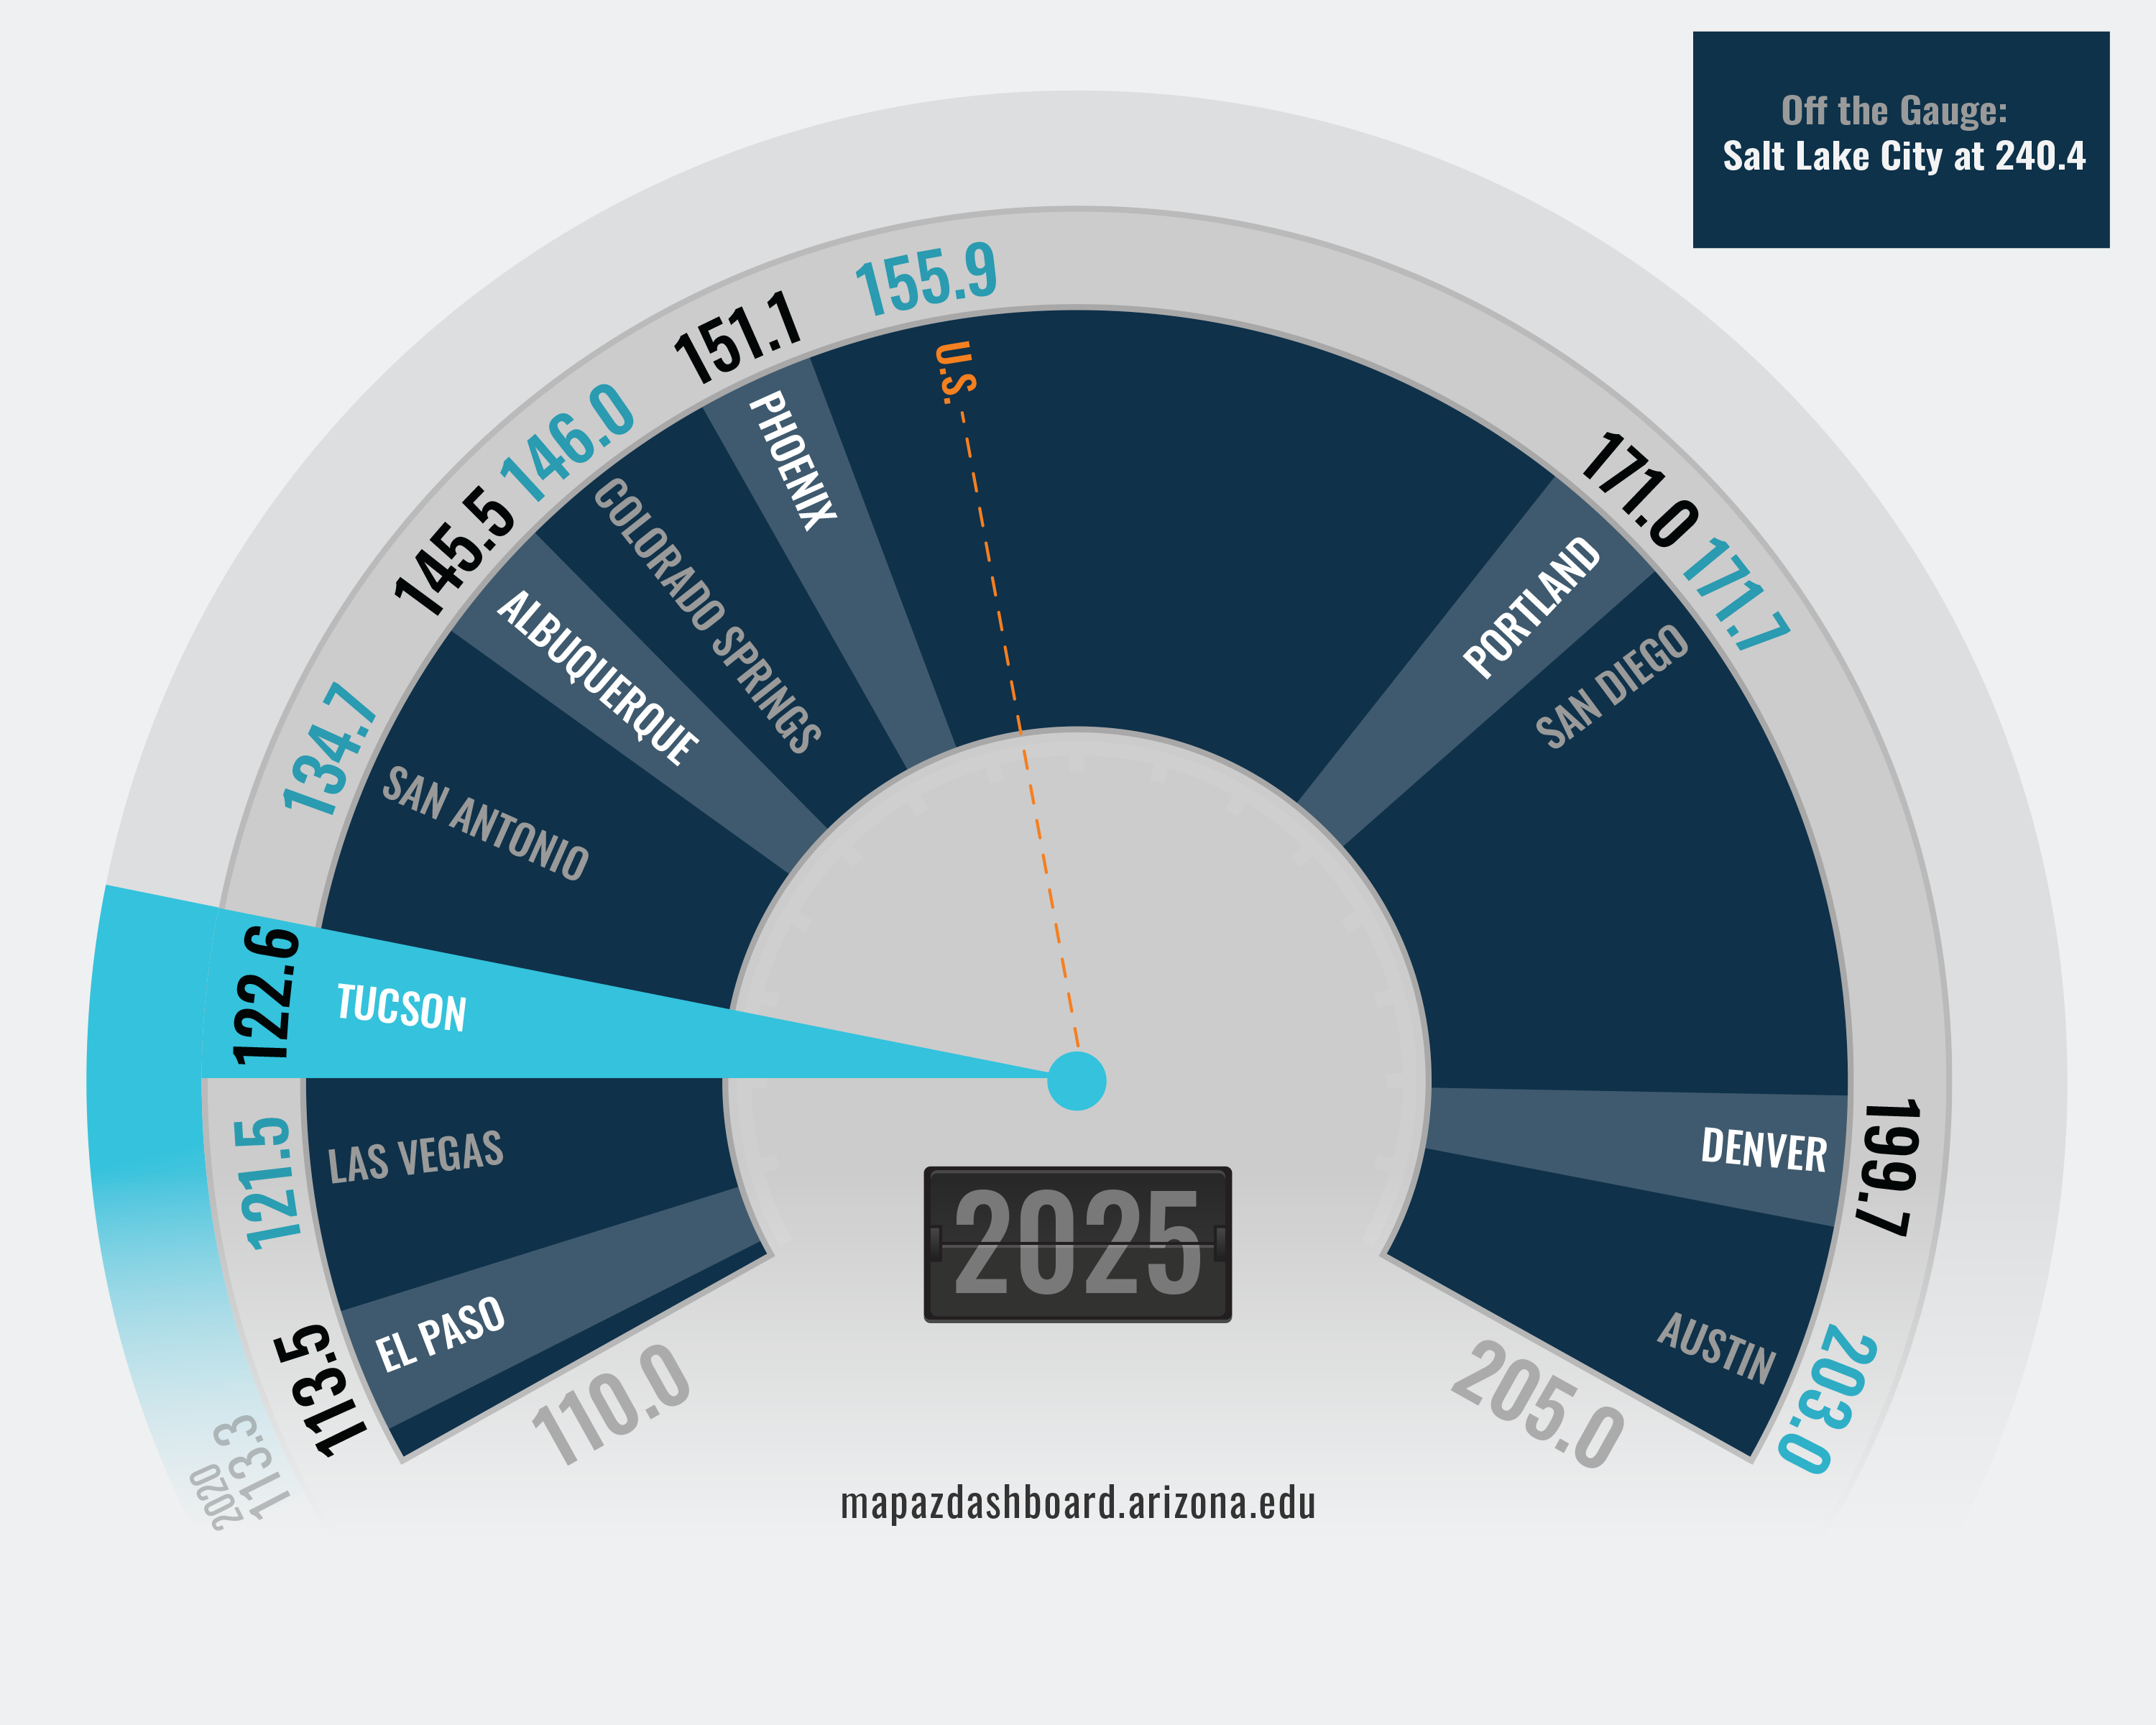
Employment in creative occupations in the Tucson Metropolitan Statistical Area (MSA) was below the national average in 2025, at 122.6 jobs per 1,000 residents. The national average was 155.9. Tucson ranked 10th among peer western metropolitan areas. Salt Lake City ranked first with 240.4 jobs per 1,000 residents, while El Paso ranked last with 113.5 jobs per 1,000 residents. Between 2020 and 2025, Tucson posted a modest increase in employment per resident in creative occupations.
Average wages for workers in creative occupations in Tucson were $93,895 in 2025, nearly $13,000 below the national average of $106,932. Tucson ranked near the bottom among peer western metropolitan areas. Creative workers in San Diego earned the highest average wage at $120,767.
Why is it important?
Creative occupations are often associated with innovation, problem-solving, research, design, technology, education, and professional services. These occupations can contribute to economic growth by supporting the development of new ideas, products, and services. The MAP Dashboard follows the creative class framework developed by Richard Florida, which groups creative occupations into two categories: the super creative core and creative professionals. Together, these occupations are often associated with higher levels of innovation, entrepreneurship, and knowledge-based activity. Tracking employment and wages in creative occupations provides insight into the role these workers play in the regional economy and how Tucson compares to peer metropolitan areas.
How do we compare?
Employment in creative occupations in Tucson reached 134,080 in 2025, accounting for 34.4% of total jobs. That was similar to the national share of 34.3%. In Tucson, employment in creative professional occupations was 81,880 in 2025, while the super creative core employed 52,200. That translated into 74.9 creative professional jobs and 47.7 super creative core jobs per 1,000 residents. Tucson reported fewer creative professional and super creative core jobs per resident than the national average.
The average wage for workers in creative occupations in Tucson was $93,895 in 2025, well above the all-occupation average of $63,200. Average wages for creative professionals were $103,597. Super creative core workers in Tucson earned an average wage of $78,677 in 2025, trailing the national average of $89,208 by about $10,500. In 2025, super creative core wages in Tucson ranked ninth among peer western metros tracked on the MAP Dashboard. Additional metropolitan area data are available on the Creative Occupations Comparison Page.
What are the key trends?
Employment in creative occupations in Tucson increased by 13.2% between 2020 and 2025. While employment growth was positive, it lagged both Arizona (21.9%) and the nation (19.0%) over the same period. Growth rates for the super creative core and creative professionals are available on the Creative Occupations Comparison Page.
Wages for creative occupations increased in Tucson, Arizona, and nationwide between 2003 and 2025. Wages in creative occupations nationally increased by 83.5% during this period, while Arizona posted faster growth at 89.2%. Tucson’s growth rate was similar to the nation at 82.9%. Despite long-term wage gains, average wages for creative occupations in Tucson remained approximately $13,000 below the national average in 2025.
How is it measured?
The MAP Dashboard defines creative occupations using the framework developed by Richard Florida in The Rise of the Creative Class. Creative occupations are grouped into two categories: the super creative core and creative professionals. Occupations are classified using the federal Standard Occupational Classification (SOC) system. Detailed employment and wage data come from the Bureau of Labor Statistics Occupational Employment and Wage Statistics (OEWS) program. The OEWS provides employment and wage estimates for more than 800 occupations and industries. Occupational wages are measured before taxes and do not include fringe benefits.
Creative Occupations (two sub-groups)
Super Creative Core
- Computer and mathematical occupations
- Architecture and engineering occupations
- Life, physical, and social science occupations
- Education, training, and library occupations
- Arts, design, entertainment, sports, and media occupations
Creative Professionals
- Management occupations
- Business and financial operations occupations
- Legal occupations
- Healthcare practitioners and technical occupations


