Have you ever wondered how affordable housing is in Tucson? Now you can find out on the MAP Dashboard. The MAP recently released the Housing Affordability indicator that calculates the share of homes sold that are affordable to those earning...
If you want to be a part of a thriving community that will allow you to be active and engaged well into your retirement years, where would that be? The Milken Institute recently released the 2016 Best Cities for Successful...
How healthy is your neighborhood? Are your neighbors physically active? How do they report their mental and physical health? How often do they visit the doctor? Thanks to the Robert Wood Johnson Foundation and the Centers for Disease Control (CDC)...
In 2015, American Indians living in Arizona fared significantly better than the state average in the reported number of incidents of lung cancer, lower respiratory diseases, and Alzheimer’s, according to a report published by the Arizona Department of Health Services...
Tucsonans engaged in more leisure-time physical activity than the average U.S. resident, according to data from the 500 Cities Project. This report focuses on city-level data, which differs from the county-level aggregations that make up Metropolitan Statistical Area (MSA) data...
The Tucson Airport Authority and Tucson Values Teachers were both awarded prizes of $5,000 each for winning the MAP Dashboard's Community Action Figure Awards Contest. Each organization utilized the dashboard's data to improve the community. Read more about it by...
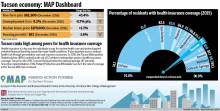
Health insurance is a key way for individuals to pay for routine health care and protect against potential financial hardship caused by major health problems. It also expands access, reduces health risk through preventative care, and improves outcomes. In 2015...
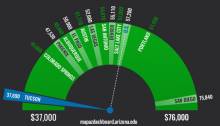
Have you ever wondered how Tucson’s wages fare when compared to other metropolitan areas around the West or which occupations in Tucson earn the most, the least? Tucson’s median wage for all occupations in 2015 was $33,000, which ranked 10...
TUCSON — Southern Arizonans using MAP Dashboard’s data to improve their communities can enter the “Community Action Figure Awards Contest” and have a chance to win one of four $2,500 prizes. The MAP — Making Action Possible — Dashboard was...