 Learn About Bicycling Infrastructure in the City of Tucson, Arizona
How are we doing?
Bicycling Miles per 10,000 Residents (2018 Report)

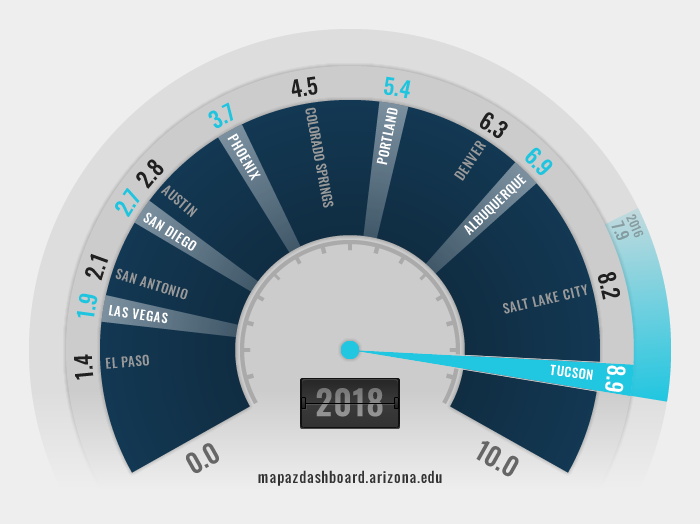
Tucson ranked first out of 12 western cities with 8.9 miles of bicycle infrastructure per 10,000 residents according to the 2018 Alliance Benchmarking Report. Salt Lake City ranked second with 8.2 miles per 10,000 residents, while El Paso placed last with 1.4 miles. Miles of bicycle infrastructure include bicycle-only lanes that are adjacent to the roadway but separated from motorized vehicles with a physical barrier (protected bike lanes), unprotected bike lanes, and multi-use paths. Multi-use paths allow for other non-vehicle activities such as walking, running, and horseback riding. The Loop, Pima County’s shared-use path around metro Tucson, is an example of a multi-use path.
Why is it important?
Bicycling is a healthy form of exercise that is non-polluting and increases social interaction. According to the report, numerous studies have shown a positive link between physical activity and public health. Bicycle commuting is one way to increase a population's level of physical activity. For comparative statistics on bicycle commuting visit the Transportation to Work indicator page.
The quality and depth of bicycle and pedestrian facilities within a community expand the number of non-vehicle options, positively affecting public safety by reducing the number of cars on the street. Specific types of bicycling facilities impact the level of cycling participation. For example, protected bike lanes have been shown to increase participation levels (2018 Report). In addition to these public health benefits, a study from the New York Department of Transportation shows that higher levels of bicycling participation boost the local economy by increasing sales for businesses located along bicycle-friendly routes.
How do we compare?
Tucson provides its residents with nearly double the miles of bicycle infrastructure per square mile than the city of Phoenix. In the 2018 Report, Tucson had 2.1 miles of bicycle infrastructure per square mile while Phoenix had only 1.1 miles.
How is it measured?
The Alliance for Biking & Walking publishes the “Bicycling and Walking in the United States Benchmarking Report” every two years, providing data on active transportation and on miles of bicycling infrastructure for select cities across the country. The city level bicycle infrastructure data in the report comes from the Alliance for Biking and Walking 2018 City Survey. The report includes population data for the geographies included in the study, allowing for per capita measures to be reported.


