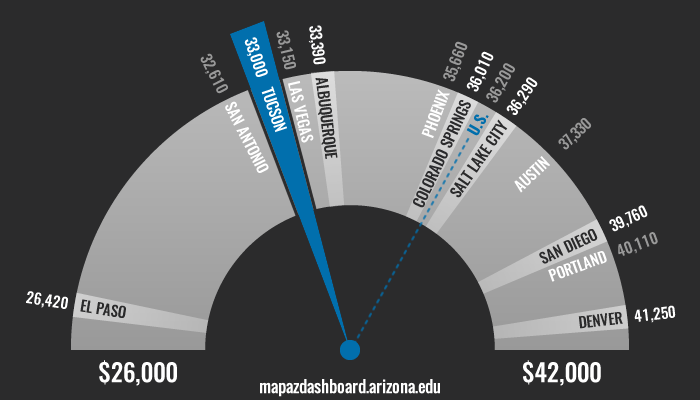
Have you ever wondered how Tucson’s wages fare when compared to other metropolitan areas around the West or which occupations in Tucson earn the most, the least? Tucson’s median wage for all occupations in 2015 was $33,000, which ranked 10th among metros tracked on the MAP Dashboard (exhibit 1). Occupational wages are important to a region because they influence relocation decisions, as well as educational choices among residents. When comparing wages across regions, it is important to keep in mind that the cost of goods and services can vary substantially between metros. Therefore, actual published wages are not always a true representation of how well-off a region’s residents are in terms of wage levels. Local wages adjusted by the cost of living can provide a much clearer reflection of purchasing power.
Exhibit 1: Median Wage for All Occupations (2015)
The price of goods and services in Tucson was relatively low in 2014 at 2.9% below the U.S. average. The latest year for which cost of living data is available is 2014. The cost of living, measured by the Regional Price Parities (RPPs), compares prices and living expenses across a wide range of items, including: housing, food, and healthcare. The cost of living allows for comparison of how expensive it is to live in one city or state versus another. This is an important consideration when relocating and/or during wage negotiations. For example, the same wage may go far in a city with a low cost of living but be insufficient in an expensive city. Exhibit 2 presents the 2014 cost of living for 12 western metropolitan areas.

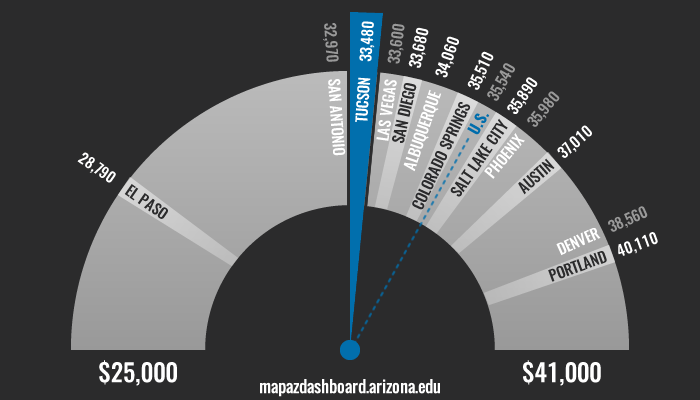
In order to get a true reflection of the purchasing power of Tucson resident wages when compared to other metros around the West, we can adjust the median occupation wage for each metro by their respective cost of living. Tucson’s cost of living adjusted median wage in 2014 was $33,480 (exhibit 3), nearly a thousand dollars higher than the unadjusted wage. Tucson remained in 10th place among comparable metros but the gap between areas tightened. This result tells us that residents who earn the median wage in Tucson can purchase more locally priced goods and services than median wage earners in El Paso or San Antonio. Residents who earn the median wage in Portland are the best off in terms of their purchasing power.
Exhibit 3: Cost of Living Adjusted Median Wage for All Occupations (2014)
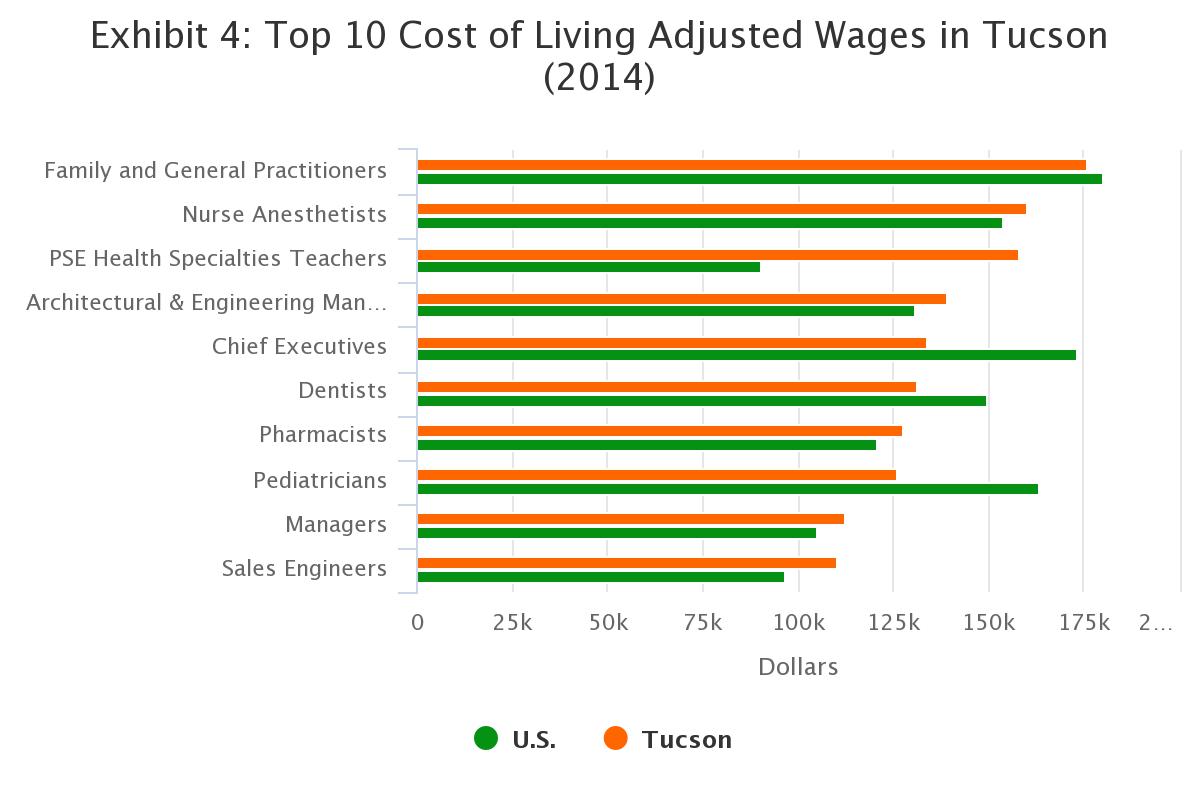
Substantial variation exists between the top and lowest paid occupations in the Tucson metro. The top paid occupation after adjusting for the cost of living in Tucson earned a median wage of $175,757, this was more than nine times the annual median wage of $18,795 for the bottom paid occupation. As one would expect, the top paid occupations include professions that require advance degrees. The top 10 paid occupations include six from the medical field: Family and General Physicians, Pediatricians, Nurse Anesthetists, Post-Secondary Health Specialties Teachers, Dentists, and Pharmacists. Other top paid occupations in Tucson include Architectural and Engineering Managers, Chief Executives, Managers, and Sales Engineers. All wages in Exhibit 4 have been adjusted by Tucson’s cost of living. Compared to the U.S. median wage Post-Secondary Health Specialties Teachers in Tucson earn 75.1% more while Pediatricians earn 22.7% less.
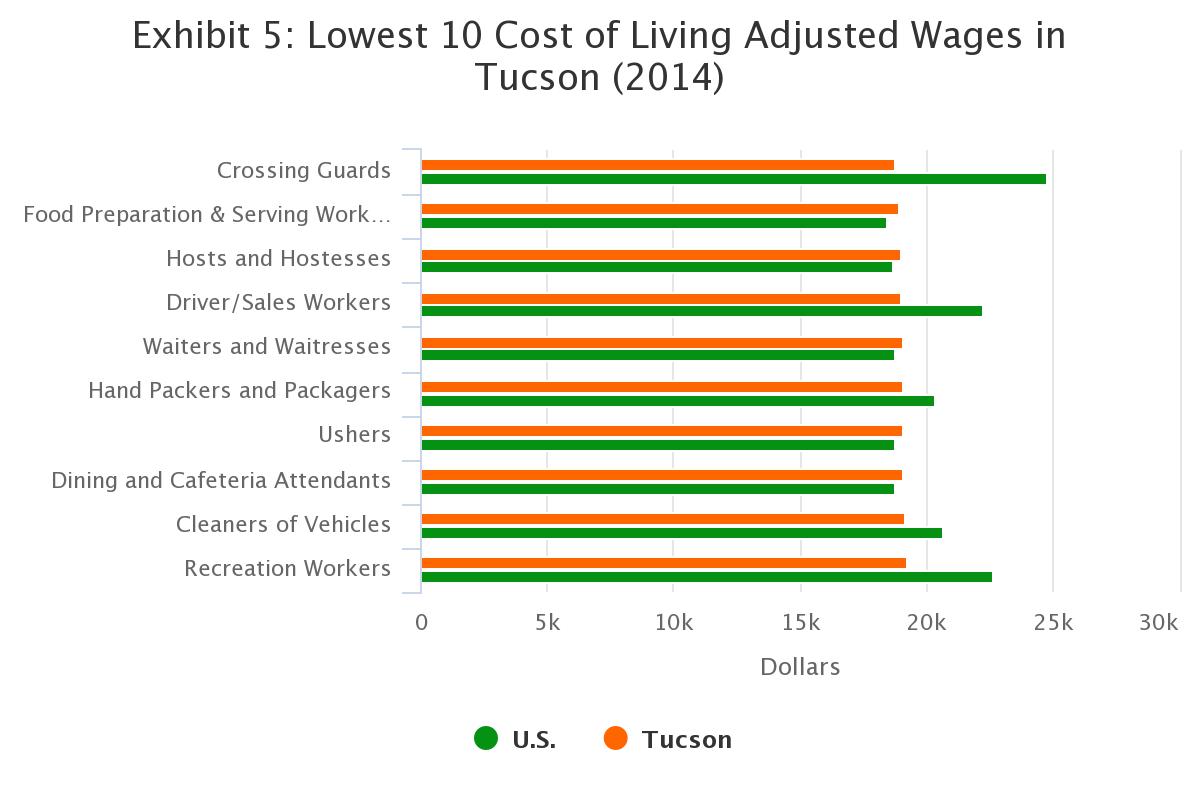
The 10 lowest paid occupations in Tucson require little to no specialized skills or education. They include Crossing Guards, Food Preparation and Serving Workers, Hosts and Hostesses, Driver/Sales Workers, Waiters and Waitresses, Hand Packers and Packagers, Ushers/Lobby Attendants/Ticket Takers, Dining and Cafeteria Attendants, Cleaners of Vehicles, and Recreation Workers. Many of the lowest paid occupations in Tucson earn a wage that is equal to or near the median U.S. wage for that occupation. However, three of the 10 lowest paid occupations earned 15% less than the respective median U.S. wage: Recreation Workers, Driver/Sales Workers, and Crossing Guards. Exhibit 5 displays the 10 occupations in Tucson with the lowest cost of living adjusted median wage.
In 2014, the Bureau of Labor Statistics (BLS) reported wages for 525 occupations in the Tucson Metropolitan Area. Of those 525 occupations 337, or 64%, earned less than their U.S. peers after adjusting wages in Tucson by the cost of living. The largest difference is among Labor Relation Specialists. The cost of living adjusted median wage for a Labor Relation Specialist in Tucson was $24,181, while the U.S. median wage for that occupation was $56,950 indicating that Labor Relation Specialist in Tucson earn 57.5% less than their U.S. peers. After adjusting for the cost of living, 36% of occupations in Tucson have a wage that is higher than or equal to the U.S. median for that specific occupation. Only 27 occupations in Tucson have wages that are more than 20% higher than the U.S. equivalent including: Dental Hygienists, Animal Trainers, Court Reporters, Counselors, Welders, Post-Secondary Teachers, and Skincare Specialists. Motor Vehicle Operators in Tucson have the highest pay gap when compared to their peers across the U.S. In Tucson the median cost of living adjusted wage for a Motor Vehicle Operator was $52,616, while the U.S. median wage for that occupation was $28,910 representing a change of 82.0%. Exhibit 6 shows wage levels and the percent change between Tucson’s cost of living adjusted wages and the U.S. for the top and bottom 10 occupations.
Exhibit 6: Top and Bottom 10 Occupations in Tucson by Cost of Living Adjusted Wage
| Occupation | Cost of Living Adjusted Tucson Wage | U.S. Wage | % Change |
|---|---|---|---|
Motor Vehicle Operators, All Other | $52,616 | $28,910 | 82.0% |
Postsecondary Health Specialties Teachers | $157,930 | $90,210 | 75.1% |
Skincare Specialists | $49,712 | $29,050 | 71.1% |
Production Workers, All Other | $44,428 | $28,260 | 57.2% |
Postsecondary Teachers, All Other | $91,020 | $62,330 | 46.0% |
Home Appliance Repairers | $51,421 | $35,410 | 45.2% |
Welding, Soldering, and Brazing Machine Setters, Operators, and Tenders | $50,978 | $35,180 | 44.9% |
Emergency Medical Technicians and Paramedics | $44,428 | $31,700 | 40.2% |
Residential Advisors | $33,460 | $24,340 | 37.5% |
Counselors, All Other | $59,876 | $44,830 | 33.6% |
| ----------------------------------------------------------- | --------------------------------------- | ----------------------- | -------------------- |
Real Estate Brokers | $36,622 | $57,360 | -36.2% |
Interviewers, Except Eligibility and Loan | $19,588 | $30,790 | -36.4% |
Geological and Petroleum Technicians | $34,336 | $54,810 | -37.4% |
Mental Health and Substance Abuse Social Workers | $25,705 | $41,380 | -37.9% |
Postsecondary Computer Science Teachers | $44,583 | $72,010 | -38.1% |
Information Security Analysts | $52,606 | $88,890 | -40.8% |
Teachers and Instructors, All Other, Except Substitute Teachers | $23,883 | $41,390 | -42.3% |
Personal Financial Advisors | $45,201 | $81,060 | -44.2% |
Securities, Commodities, and Financial Services Sales Agents | $38,177 | $72,070 | -47.0% |
Labor Relations Specialists | $24,181 | $56,950 | -57.5% |
To view the cost of living adjusted median wages for all 525 Tucson Occupations reported by the BLS visit the Occupations in Tucson by Cost of Living Adjusted Wage PDF.
To explore the median wage for all major occupations in detail visit the Median Occupational Wage indicator on the MAP Dashboard. To view the cost of living broken down into sub-categories or learn about the inflation rate over time visit the Cost of Living indicator.


