 Examine Housing Affordability Trends in Tucson, Arizona MSA
How are we doing?
Housing Affordability (2023)
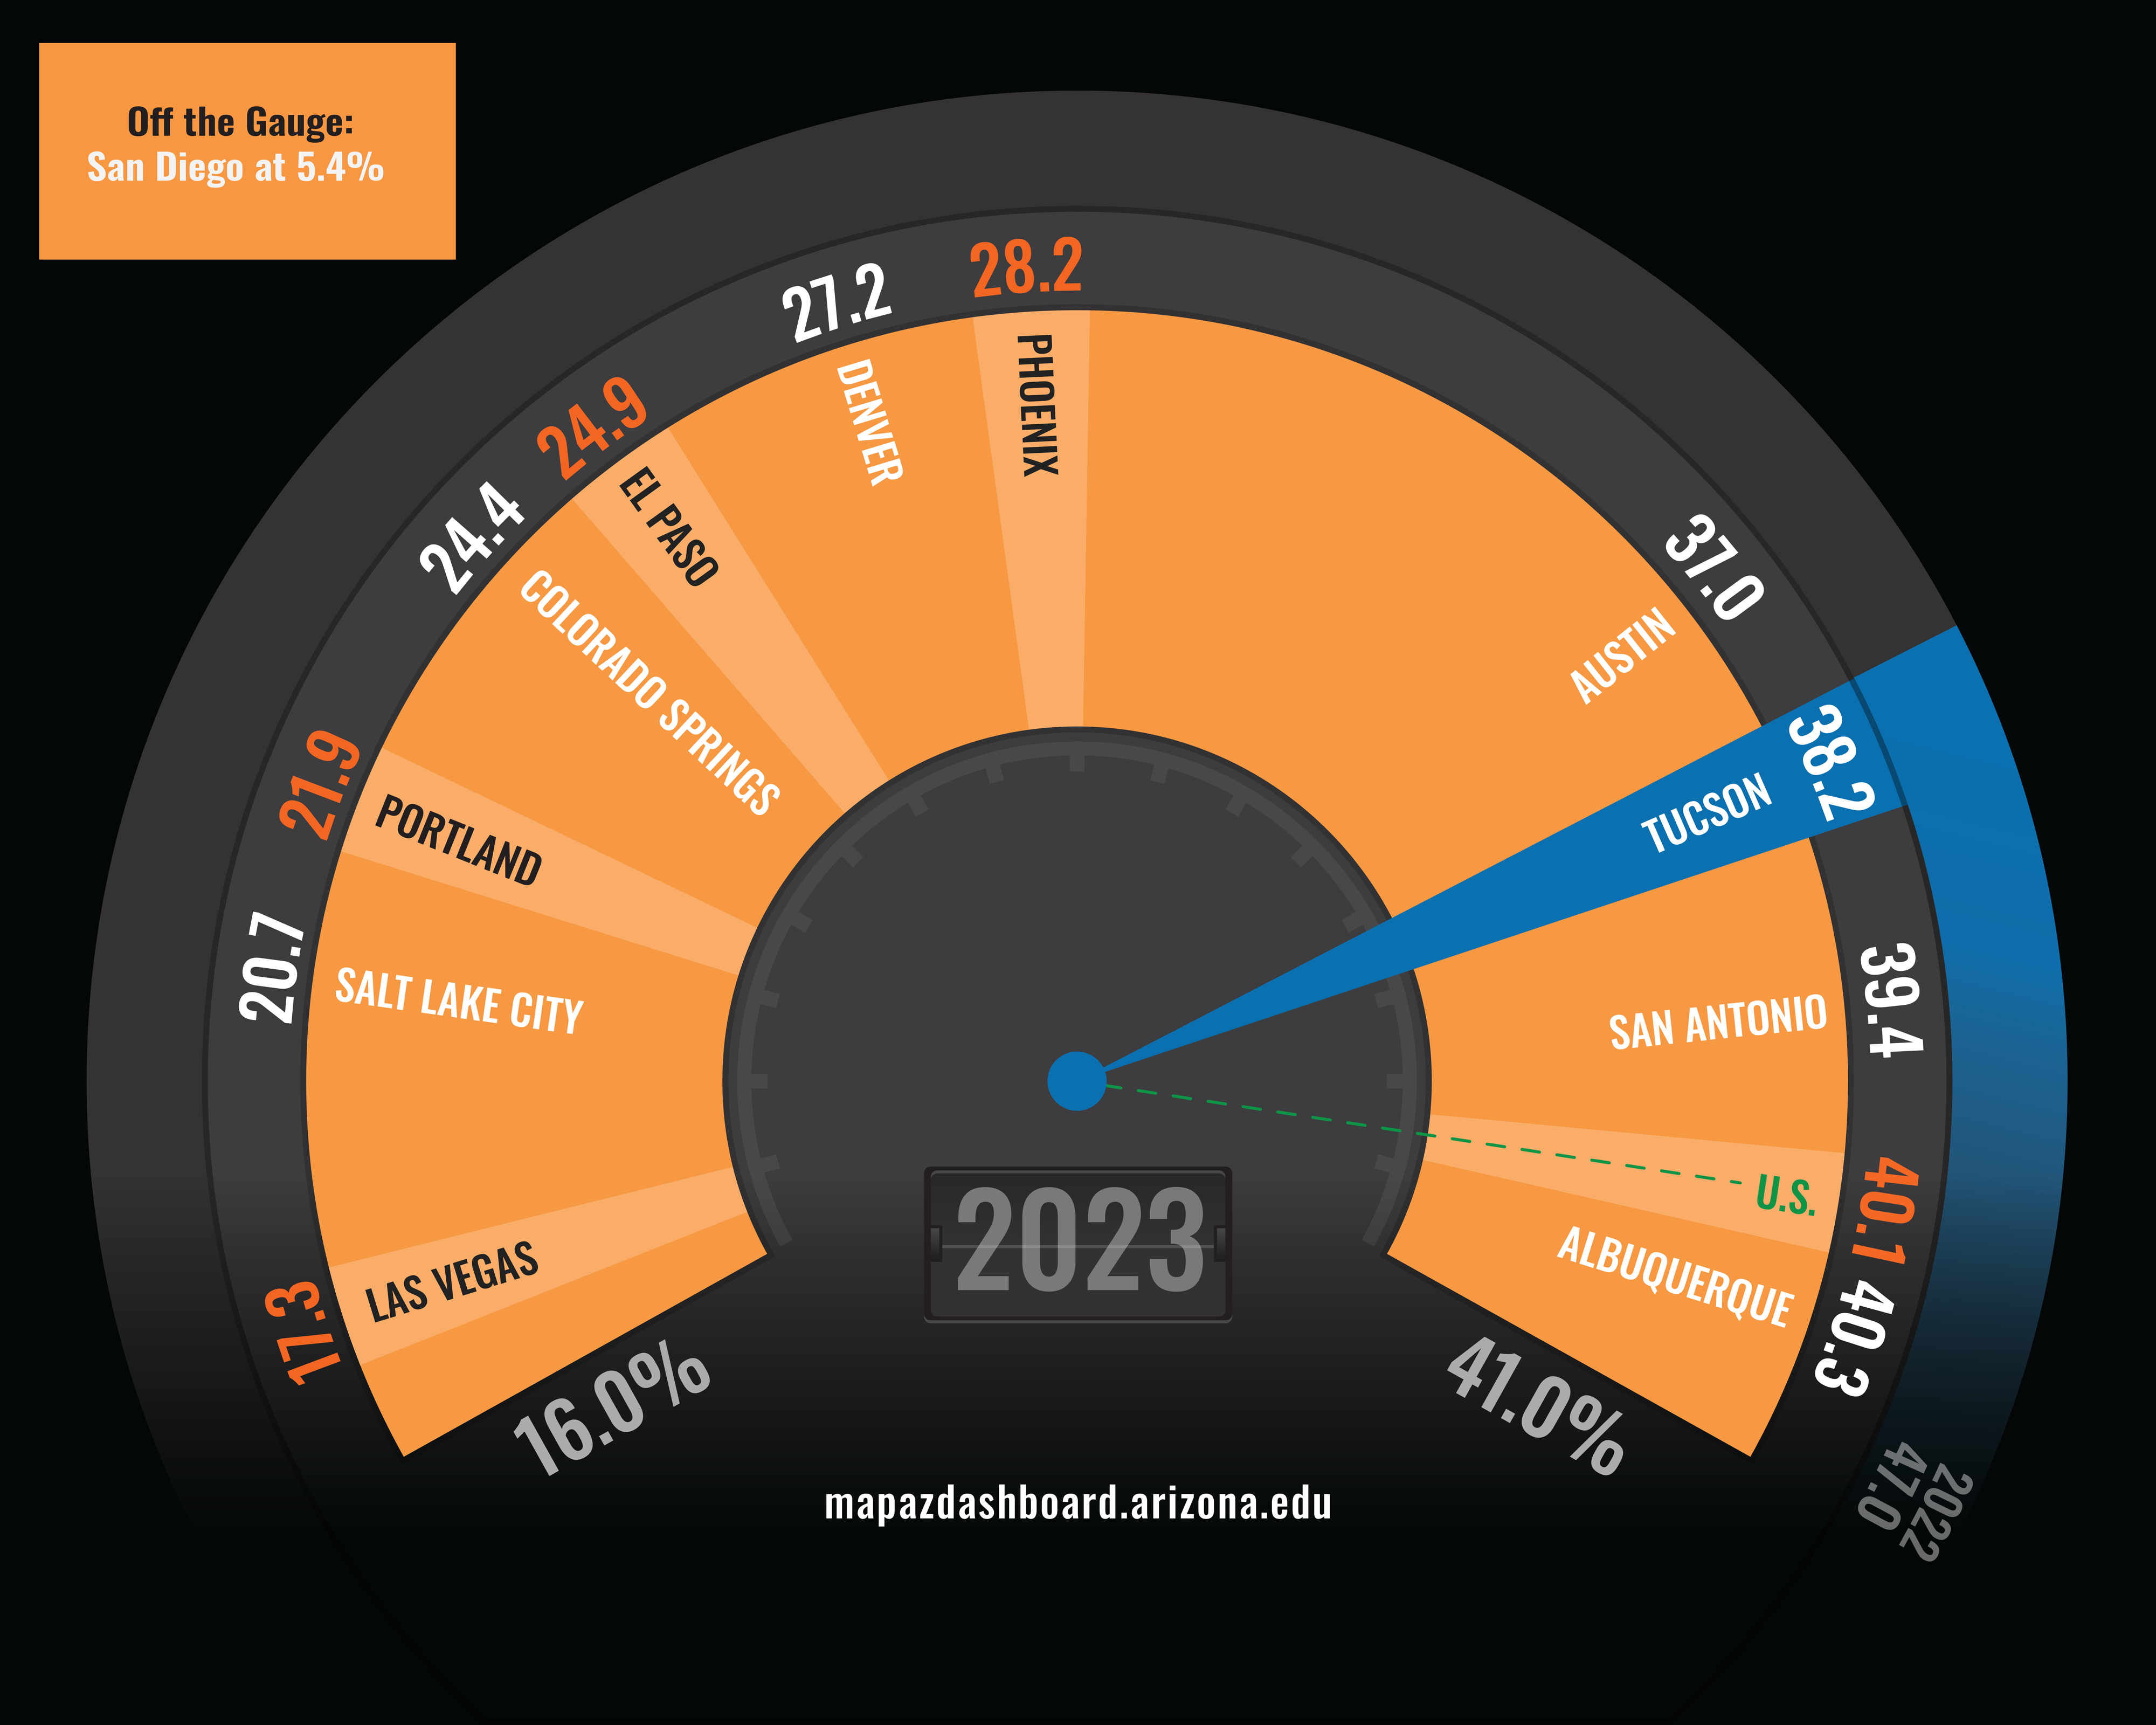
In 2023, 38.2% of homes sold in the Tucson Metropolitan Statistical Area (MSA) were affordable to a family earning the local median income. That was a significant decrease from 2022. Tucson ranked third among peer metropolitan areas in housing affordability, behind Albuquerque and San Antonio. Only 40.1% of homes in the U.S. were affordable to families earning the median income for the nation, while the share of affordable homes in Las Vegas was below 20%. San Diego’s share of affordable homes was so low, at 5.4%, that it was off the chart!
All the MSAs tracked on the MAP, except Austin and Phoenix, reported a continued decrease in the percentage of affordable homes in 2023. That followed significant decreases in 2021 and 2022. El Paso posted the largest decline in housing affordability in 2023. Austin's housing affordability increased by 5.4 percentage points, while Phoenix improved by two-tenths of a percentage point. San Diego’s housing affordability was already below 10% in 2022 and dropped even further to 5.4% in 2023. The median home price in most MSAs across the West is rising faster than wages. Historically the share of affordable homes in Tucson has fluctuated. However, in 2023 the share of affordable homes fell below the nation for the first time in 15 years.
Why is it important?
Housing affordability is an important issue for many households. Access to affordable housing is important because the home is the largest asset for most people, and its price can affect spending in other areas such as childcare, education, health care, and leisure activities. Since personal consumption makes up the better part of the economy, and the cost of housing influences discretionary income levels, home prices are an important factor in the local economy. Several factors can influence home prices, including mortgage rates, demographics, income growth, the supply of new housing, and speculative trends. Housing affordability is determined by the share of homes sold in an area that would have been affordable to a family earning the local median income. Housing affordability data comes from the National Association of Home Builders (NAHB).
What are the key trends?
The share of homes sold in Tucson during 2023 that were affordable to a family earning the median income was 38.2%. That was 8.8 percentage points lower than in 2022 and a decline of 26.3 percentage points from 2021. Tucson fell below the U.S. for the first time in 15 years. The share of affordable homes in Phoenix (28.2%) fell below the U.S. share for the first time in 14 years in 2021, continued to decline in 2022, and increased slightly in 2023. Tucson’s share of affordable homes has fluctuated significantly during the past eighteen years with a low in 2006, just before the housing boom, and a high of 86.2% in 2012.
Between 2012 and 2018, housing affordability declined as home prices rose faster than wages. In 2019 and 2020, wages in Tucson increased at the fastest rates since the Great Recession which in turn improved housing affordability. However, housing affordability declined significantly between 2021 and 2023 in Tucson, and across the nation, because home prices rose at a much faster pace than wages.
Note the change in methodology in how housing affordability measures are calculated starting in 2012, full details on the change can be found in the "How is it Measured Section" below.
How is it measured?
Housing affordability data comes from the National Association of Home Builders (NAHB). The index is calculated for a given area based on two major components: income and housing. NAHB’s methodology includes using annual median family income estimates and assumes that a family can afford to spend 28% of its gross income on housing. Additionally, monthly sales transaction records determine the sales price of sold homes. Further, NAHB calculates the monthly principal, interest, and taxes based on a 30-year fixed-rate mortgage with a loan for 90% of the sales price. The data is reported quarterly and the Making Action Possible (MAP) research team aggregates the data to an annual index value.
In the spring of 2019, the FHFA interest rate series used to calculate the Housing Opportunity Index (Housing Affordability Rate) was discontinued. Beginning in the second quarter of 2019, the Housing Opportunity Index had to be calculated using a new interest rate series from Freddie Mac. The two interest rate series are conceptually different. To preserve comparability, NAHB revised the Housing Opportunity Index back to 2012 using the new Freddie Mac interest rate series. Trend data presented above can be compared between 2000 - 2011 and 2012 - present.


