Did household debt play a role in the sluggish recovery from the 2008-2009 recession? Recent research suggests that it did. What does this mean for the current COVID-19 induced downturn? The Board of Governors of the Federal Reserve System recently released a new dataset on household debt-to-income ratios (DTI) at the state, metropolitan statistical area, and county level going back to 1999. These data allow for the analysis of the debt-to-income ratio during the prior recession and recovery, which may provide insights for the COVID-19 downturn.
Household debt, or the debt-to-income ratio, for this article, includes all debt owed by a household, excluding student loans, relative to household income. A household’s debt-to-income ratio is often used by lenders as a measure of a household’s ability to repay money that has been borrowed. Typically, lenders prefer a lower debt-to-income ratio when making loans.
For the purpose of this article, aggregated household debt by geographic region is explored relative to income in the 4th quarter. This allows for the examination of regional debt-to-income variation.
In 2018, Arizona posted one of the highest debt-to-income ratios among the western states. Arizona, Colorado, and Idaho all had a debt-to-income ratio of 1.8, meaning that total debt for those sampled exceeded income by 80%. Texas posted the lowest debt-to-income level at 1.1 among the western states. As illustrated in Figure 1, the western states as a whole are significantly more leveraged than the rest of the United States, with the exception of a few states on the east coast.
Figure 1: Debt-to-Income Ratios for the U.S. in the Fourth Quarter of 2018
When breaking down the state data into smaller geographic regions it becomes apparent that there is significantly more variation in debt-to-income ratios. In 2018, the debt-to-income ratio varied from 0.78 to 3.46 amongst Arizona counties. La Paz County posted the lowest debt-to-income ratio of 0.78, whereas Pinal had the highest at 3.46 (Figure 2). Mohave, and Yavapai counties also had debt-to-income ratios that exceeded the state ratio of 1.8. Data for Greenlee were not available.
The FEDS notes posted on the Board of Governors of the Federal Reserve System website suggests that this variation amongst counties helps to explain which areas were ultimately hit hardest by the 2008-2009 recession. Prior to the 2008-2009 recession, Pinal, Gila, Mohave, and Yavapai counties all had a debt-to-income ratio of 3.46.
Figure 2: Arizona County Debt-to-Income Ratios in the Fourth Quarter of 2018
What are the Key Trends?
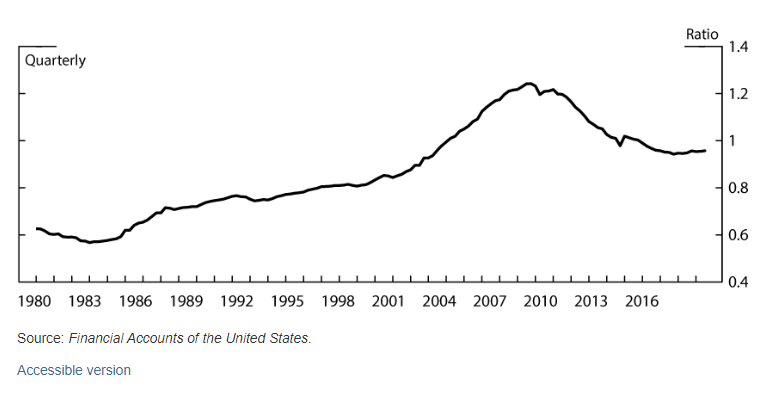
Nationwide the household debt ratio reached a record high prior to the 2008-2009 recession, as seen in Figure 3. The debt-to-income ratio increased sharply nationwide in the years preceding the 2008-2009 recession, in part driven by the housing boom. Household debt then began to fall at the beginning of the recession. The decline in household debt was driven by a variety of factors including a reduction in personal expenditures and loan defaults. Keep in mind that the western states are more leveraged than the nation as a whole, due to their higher debt-to-income ratios.
Figure 3: Aggregate Household Debt-to-Income Ratio
Recent research suggests there is a relationship between areas that have high debt-to-income levels and slow economic recovery. The differences in the debt-to-income levels are more pronounced at the county level. However, as the FEDS notes point out enough variation exists, even at the state-level, that economic policy initiatives could have substantially different effects depending on how leveraged each area’s households are.
Figure 4 shows trends in the debt-to-income ratios for Arizona, Phoenix, and Tucson. The metropolitan level data is reported as data bins, so the data appears in a more stepped pattern. Tucson’s debt-to-income ratio increased through 2006 and then began to decline in 2012. The Phoenix MSA and Arizona followed the same pattern, but Phoenix’s 2008 debt-to-income ratio of 2.57 exceeded both Tucson and the state. Colorado Springs, Las Vegas, and San Diego also had a debt-to-income ratio of 2.57 in 2008, while El Paso, Austin, and San Antonio had the lowest pre-2008 recession ratio of 1.49.
Figure 4 includes the debt-to-income ratio for all of Tucson’s peer MSAs. To view the data click on the greyed-out MSA name.
Figure 4: Household Debt-to-Income Ratios for Arizona and Western Metropolitan Areas
When comparing the debt-to-income ratio just prior to the 2008-2009 recession to 2018, every MSA explored had a lower ratio. The difference was minimal for some MSAs, like El Paso and San Antonio, which indicates only a slightly lower debt-to-income ratio for those households. Select metropolitan areas like Las Vegas, Phoenix, and San Diego had significantly lower debt-to-income ratios in 2018 than they did in 2008. Interestingly, these MSAs happened to have some of the fastest rising home prices in the nation just before the 2008 housing boom. These MSAs experienced sharply declining home prices and a plethora of home-loan defaults following the housing boom.
As mentioned above, the FEDS Notes suggest that the declining debt-to-income ratio was in part driven by households defaulting on loans. If household leverage plays a role in how swift a region rebounds from an economic downturn, as suggested by the economic data available from the 2008-2009 recession, each of the MSAs explored here are better positioned in terms of household debt than they were prior to the 2008-2009 recession.
Figure 5: Western Metropolitan Area Household Debt-to-Income Ratios
How is it Measured?
Household debt, or the debt-to-income ratio, is calculated using the Equifax/Federal Reserve Bank of New York Consumer Credit Panel data for debt, and household income data from the Bureau of Labor Statistics. The debit data includes all types of debt reported in the credit file excluding student loans. Household debt is calculated by summing all individual balances and 50 percent of joint balances for each member of the household.


