 Explore the Tucson MSA's Progress Over the Past Decade
This report measures the progress of Southern Arizona over the past decade. It highlights the region's strengths and identifies challenges. The MAP aims to measurably improve Southern Arizona through data-driven collective civic action and education. The data and analysis presented on the MAP Dashboard facilitate this by identifying key trends, tracking performance, and informing future policy decisions. The MAP measures progress and inspires action by providing our leaders with facts that inform their decision-making on key issues in Southern Arizona. As the MAP Dashboard celebrates its 10th anniversary, we will examine how the economy has improved (or not) in our region over the past decade.
Tucson's Strengths Over the Past Decade
Key changes over the past decade are highlighted below for the MAP's economy indicators, using an interactive graphic. The MAP Dashboard compares the Tucson Metropolitan Statistical Area (MSA) to other peer regions around the West. In some cases, only select regions are included in the interactive graphics to emphasize Tucson’s change. Data for all areas are available under each indicator’s core landing page. They are linked throughout the article.
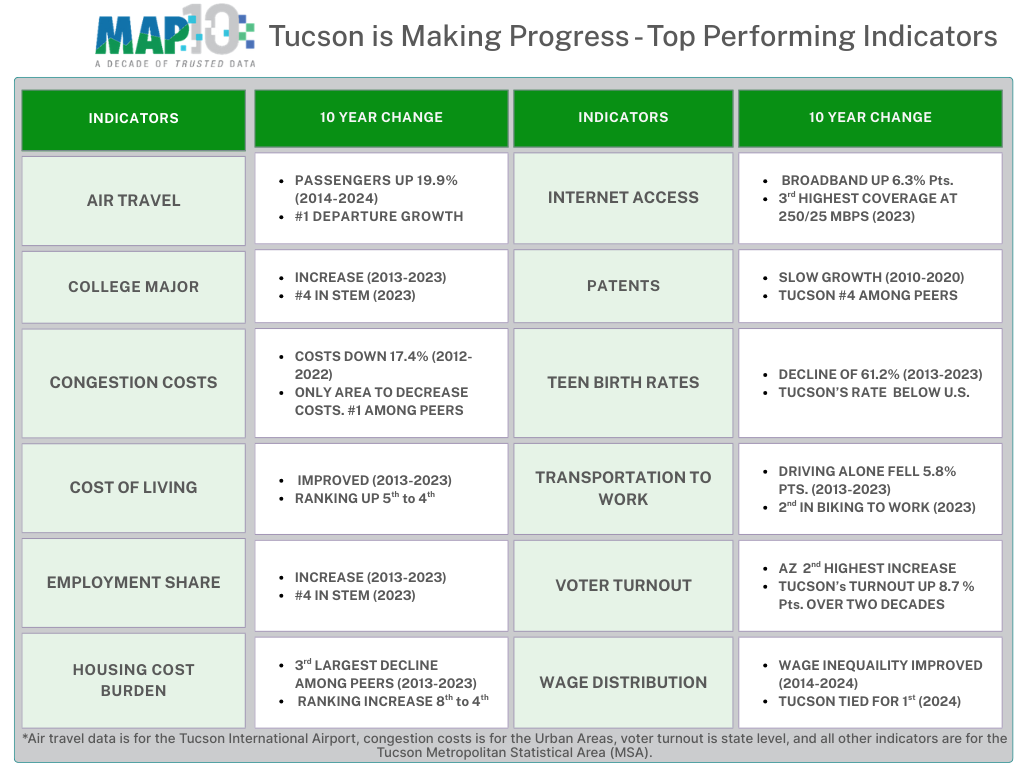
Over the past decade, Tucson has demonstrated measurable progress across several key indicators. Air travel activity increased nearly 20%, while congestion costs declined by more than 17%, making Tucson the only peer community to see a decrease in congestion costs. Broadband access continued to expand, and the region now ranks among the highest for 250/25 Mbps coverage. Positive shifts are also evident in education and workforce measures, with growth in STEM majors and employment share. Social outcomes improved as well: teen birth rates fell more than 60%, the share of residents driving alone declined, and voter turnout recorded one of the largest increases statewide. Cost-of-living and wage distribution trends also strengthened, reflecting a more stable economic environment. Together, these indicators highlight areas where Tucson is making progress and advancing its long-term competitiveness.
Tucson's Challenges Over the Past Decade
While Tucson has made significant progress across several measures over the past decade, multiple indicators point to persistent or emerging challenges that require our region's attention. Compared with our peer MSAs, Tucson saw declines in several key health and social well-being measures, including behavioral health and physical well-being. Economic and workforce indicators also highlight ongoing challenges. The Tucson MSA recorded the slowest job growth among its peers over the decade, and educational attainment rates continue to lag the nation and peer MSAs. In addition, the region experienced the largest decline in air quality, alongside increases in the violent crime rate and relatively slow income growth. Taken together, these indicators underscore areas that require sustained focus and data-informed policies to support improved community outcomes.

The six articles on the MAP Dashboard, which measure progress over the past decade, provide a comprehensive, data-driven exploration of Tucson's recent progress and areas that need attention. Each article identifies both areas of improvement and ongoing challenges relative to peer regions. We encourage readers to explore these articles to gain a deeper understanding of where Tucson has improved, where disparities persist, and where data can inform policies.
- "Measuring Infrastructure Progress Over the Past Decade"
- "Measuring Education Progress Over the Past Decade"
- "Measuring Health & Social Well-Being Progress Over the Past Decade"
- "Measuring Workforce & Demographics Progress Over the Past Decade"
- "Measuring Quality of Place Progress Over the Past Decade"
- "Measuring the Economy's Progress Over the Past Decade"


