 Snapshot Report for Southern Arizona Cities, Towns, and Census-Designated Places
The Southern Arizona communities snapshot provides an overview of how the 38 cities, towns, and census-designated places (CDP) within Cochise, Pima, Pinal, Greenlee, Graham, Santa Cruz, and Yuma counties are performing. Hereafter, when discussing multiple cities, towns, or census-designated places, the general term communities will be used. Select measures from MAP’s core indicators were chosen to illustrate the most recent year of data available for the Southern Arizona communities. Special features providing greater detail on select indicators will be published on the MAP Dashboard throughout the year. For example, upcoming special features may include the poverty rate explored by race, family type, and age. You can find these special features in the MAP library under the Southern Arizona Communities category.
In 2024, the city of Tucson was the largest Southern Arizona community, with a population of 547,073, reflecting population growth of 12.4% since 2000 (see Figure 1). The next four largest communities were significantly smaller. These included the city of Yuma (100,139), the Casas Adobes CDP (72,059), and the cities of Maricopa (67,163) and Casa Grande (60,905). The town of Duncan had the smallest population, with 969 residents, followed by the town of Miami with 1,405 residents.
What are the key trends?
Figure 1 shows the percent change in population for Arizona places for both the 2000–2024 and 2014–2024 periods. The discussion below focuses on the 38 communities included in the Southern Arizona Snapshot. There were 20 Southern Arizona communities out of the 38 that posted population growth rates surpassing the U.S. rate of 19.0% between 2000 and 2024. The city of Maricopa posted a remarkable increase in population at 6,358.0%, by far the fastest increase in population of any of the Southern Arizona communities. The Corona de Tucson CDP and the town of Sahuarita also posted very high population growth rates with 1076.6% and 1006.2% respectively. A total of 11 communities experienced a population decline from 2000 to 2024. The town of Miami recorded the most significant decrease, with a reduction of 27.4%, followed by the city of Bisbee, which saw a decline of 18.3%. The remaining communities with population losses were the cities of Globe, Nogales, South Tucson and Willcox, and the census-designated places of Ajo, Catalina Foothills, Catalina, Morenci and Tanque Verde. More than half of the Southern Arizona communities, as well as the state of Arizona, posted faster population growth than the U.S. over this 24-year period
Looking at the more recent 2014–2024 period, population trends continued to vary considerably across the 38 communities. The town of Marana recorded the largest population increase, growing by 53.8%, followed by the Vail CDP (51.6%) and the city of Maricopa (48.0%). In contrast, several communities experienced population declines over the decade, including the cities of South Tucson (-19.8%), Willcox (-12.9%), Bisbee (-9.1%), and Douglas (-6.7%). The population of the city of Tucson increased more modestly, rising 4.2% from 525,031 residents in 2014 to 547,073 in 2024. Use the “Select a period” dropdown menu in Figure 1 to switch between population change for 2000–2024 and 2014–2024. To explore the interactive maps throughout this article, use the search box to find an Arizona city, town, or CDP, select an area from the area dropdown menu to zoom in, and hover over a place to view its data.
Figure 1: Percentage Change in Population for Arizona Places
Note: The 2000–2024 population changes for Maricopa should be interpreted with caution because of changes in geographic definitions over time.
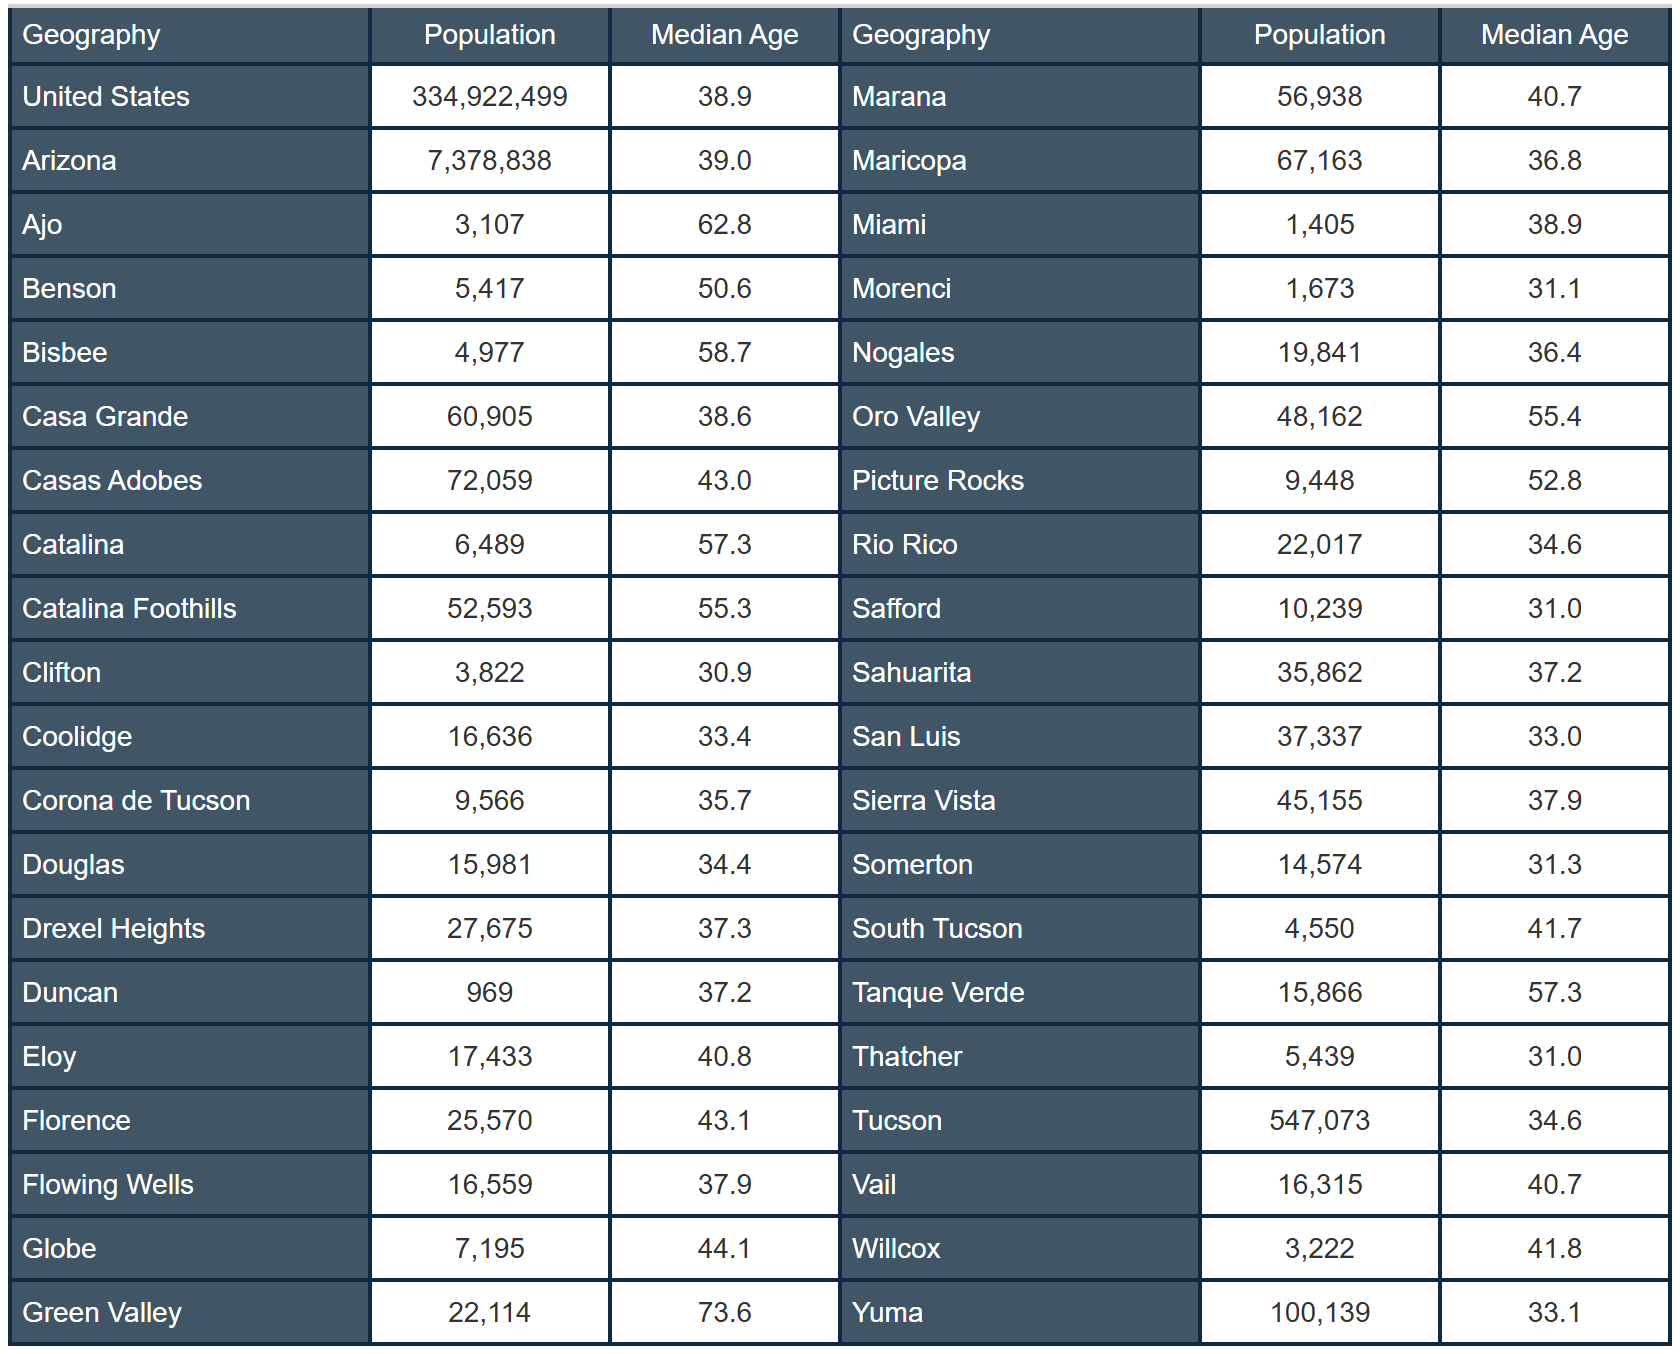
Median age varied from place to place, with the town of Clifton posting the lowest median age at 30.9 years and the Green Valley CDP posting the highest at 73.6 years. Green Valley is unique in the sense that it is a retirement community with a median age that is 34.6 years higher than the median age for the state of Arizona. Table 1 displays the population and median age for each Southern Arizona community.
Table 1: Southern Arizona Communities Population and Median Age (2024)
How are we doing?
In 2024, the poverty rate for the U.S. was 12.5%. There were 17 Southern Arizona communities with poverty rates below the U.S. rate. The lowest rates were posted by the census-designated places Tanque Verde (2.3%) and Corona de Tucson (2.6%). The town of Duncan had the highest poverty rate of the 38 communities in Southern Arizona at 36.5%, followed by the city of South Tucson (30.4%). Figure 2 illustrates these poverty rates as well as those for the other communities.
Figure 2: Poverty Rate for Arizona Places (2024)
The Corona de Tucson CDP had the highest median household income at $132,568 in 2024, followed closely by the Vail CDP at $130,904. The city of South Tucson posted the lowest median household income at $33,598. The Flowing Wells CDP followed with $39,774. Figure 3 highlights median household income by place.
Despite posting a low poverty rate in 2024, the Green Valley CDP had a low median household income at $62,063 when compared to the state and the nation. There is often a direct correlation between median household income and the poverty rate, as median household income increases the poverty rate decreases. Green Valley is unique to many of the other communities in Southern Arizona as it has a low median household income and a low poverty rate. The median age of the community may explain the low levels of poverty coupled with a median household income that is below the average. Retirement and social security play a role in Green Valley’s low median income as well. A feature on Income and Earnings takes a closer look at this concept and at median household income in other Southern Arizona communities.
Figure 3: Median Household Income for Arizona Places (2024)
An educated workforce is a key component for strong economic growth. Local areas with a high concentration of educated workers tend to generate faster long-run income, population, and job growth. Figure 4 explores each Southern Arizona community’s four-year college attainment rate. During 2024, the Catalina Foothills CDP had the highest percentage of those who were 25 years and older with a bachelor’s degree or better at 71.4%. The Tanque Verde CDP was second at 58.8%, 12.6 percentage points behind Catalina Foothills, but it surpassed the state of Arizona by a margin of 25.5 percentage points, as the state's four-year college attainment rate stood at 33.3%. The city of San Luis posted the lowest percentage of those with a bachelor’s degree or better that were 25 years and older at 9.3%.Figure 4: Bachelor’s Degree or Higher for Arizona Places (2024)
Enrollment in a quality early education program is often thought of as a precursor to later success in school. Early education enrollment for the U.S. in 2024 was 45.5%, significantly higher than the state of Arizona’s figure of 35.0%. Of the 38 communities in Southern Arizona where early education data is available, 12 communities had enrollment rates higher than the state of Arizona’s rate, the highest of which was the Vail CDP with 62.3%. The city of Douglas had the lowest percentage of three-to-four-year-olds enrolled in early education at 16.1%. Data for some smaller communities are limited because of large margins of error in the estimates. Early education enrollment for each Southern Arizona community is illustrated in Figure 5.
Figure 5: Share of 3- to 4-Year-Olds Enrolled in School for Arizona Places (2024)
How is it measured?
Except for the 2000 population data used in Figure 1, which come from the 2000 Decennial Census, the data provided for the Southern Arizona communities, the state of Arizona, and the U.S. come from the U.S. Census Bureau’s American Community Survey (ACS). The ACS is a nationwide rolling-sample survey that produces one and five-year estimates on demographic, social, housing, and economic measures. Data is only available as five-year estimate for populations smaller than 20,000. In order to compare the Southern Arizona places with the state of Arizona and the U.S. all data provided in this analysis utilized five-year estimates. Note that the ACS five-year estimates are produced over a five-year time period and can only be compared to non-overlapping five-year estimates (for example: 2005-2009 and 2010-2014).