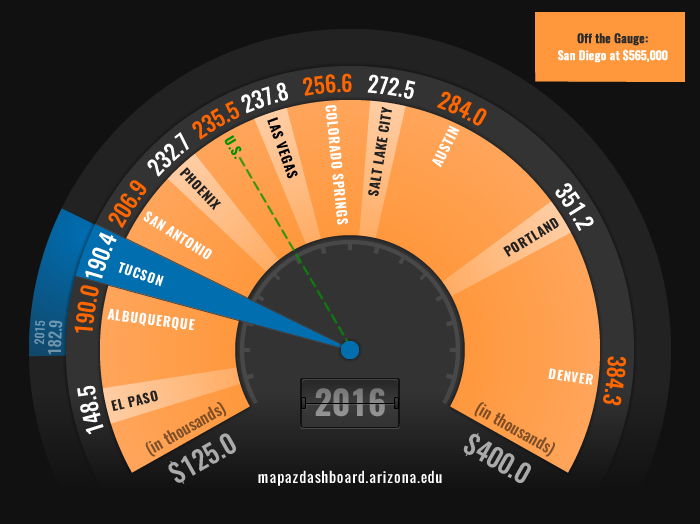
In the Tucson Metropolitan Statistical Area (MSA), the median home price rose by 4.1% in 2016. The median price, at $190,400, was relatively low compared to peer western MSAs (Figure 1). To learn more about Tucson’s home prices visit the recent feature article: Home Prices Continue to Tick Upward.
The median price of homes tells us part of the story about housing affordability, which has two major components: house/rental prices and income. We know home prices are low relative to peer western MSAs, but are they affordable to residents?
Figure 1: Median Home Price (2016)
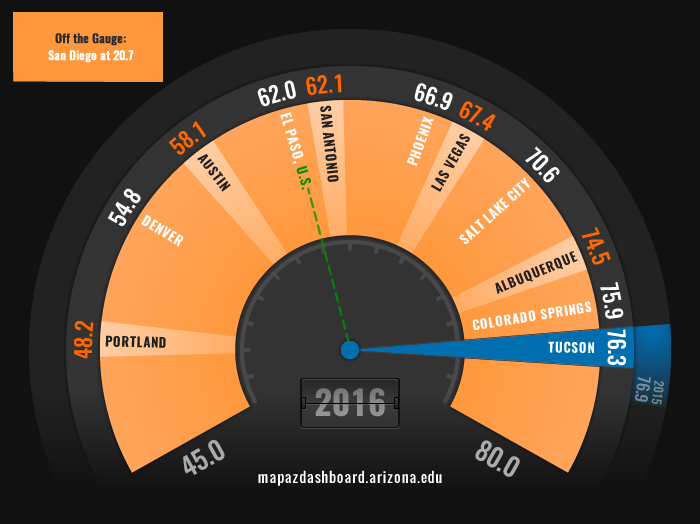
The MAP recently added a new indicator that explores housing affordability for homeowners. The Housing Affordability indicator identifies the percentage of recently sold homes that were affordable to someone earning the local median family income. In Tucson, the median family income in 2016 was just over $58,000. The measure assumes that a family can afford to spend 28% of its gross income on housing. Tucson ranked first in housing affordability among peer western MSAs, with 76.3% of homes sold in 2016 affordable to those earning the median family income (Figure 2).
Figure 2: Housing Affordability Index (2016)
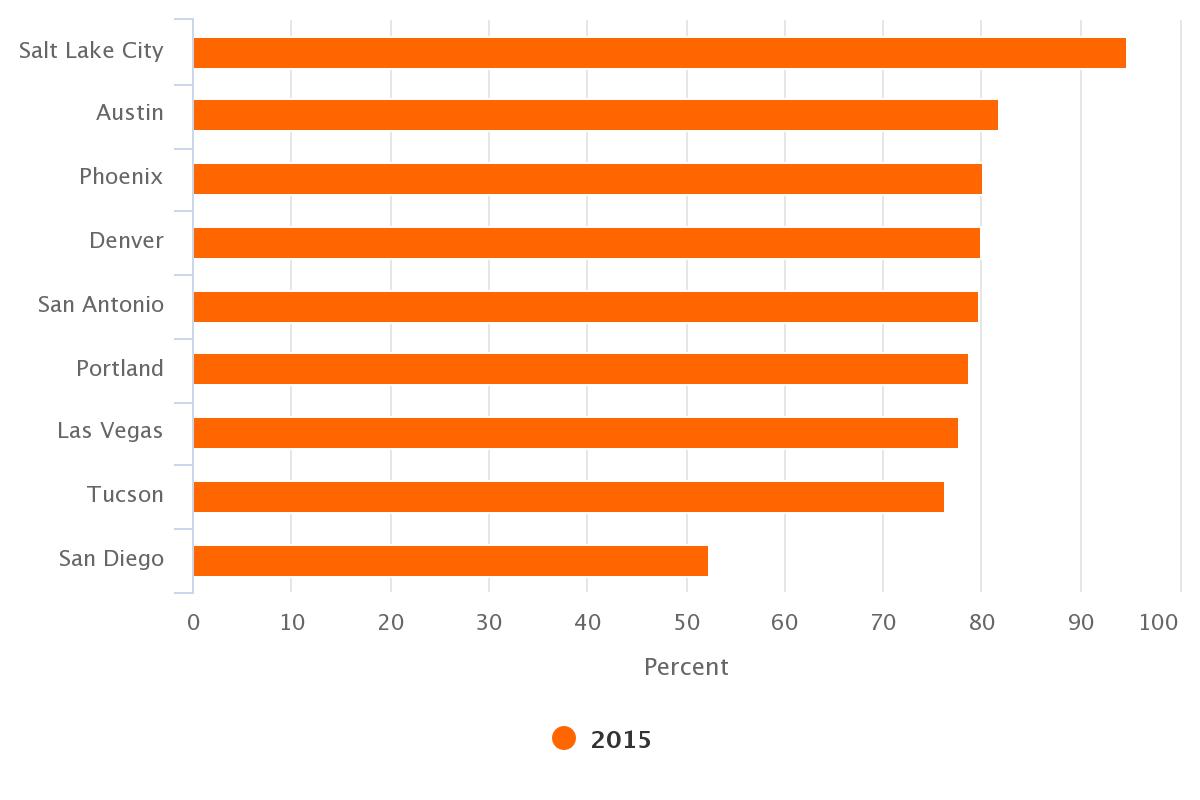
What does this mean for renters or those that earn less than the median family income? The MAP recently published a feature article, Affordable Tucson: How Do Renters Fare, that explores data published by the NYU Furman Center on rental affordability. Unfortunately, renters in Tucson do not fare as well as homeowners in terms of affordability. As Figure 3 illustrates, Tucson ranked second to last among peer MSAs in rental affordability, with 76.2% of available properties in 2015 considered affordable.
Figure 3: Share of Affordable Rentals for Those Earning the Local Median Household Income (2015)
It is important to note the difference in income measures used to calculate homeowner versus rental affordability. Housing affordability uses median family income. A family consists of more than one person in the household related by birth, marriage, or adoption. Rental affordability calculations utilize median household income, which covers all households, including those with persons living alone or multiple unrelated individuals. These households tend to have a large percentage of young or old individuals. Family income is typically higher than household income. This is an important distinction particularly for Tucson, given the high percentage of retirees and college age students. In 2016, median family income was nearly $12,000 higher than median household income for Tucson.
In addition to the affordability measures, the MAP explores Housing Cost Burden for renters and owners. Overall, the Tucson MSA ranked ninth among peer western MSAs in the percent of cost burdened households in 2016, at 34.8%. A household is considered cost burdened when it spends more than 30% of income on housing expenditures (including utilities).
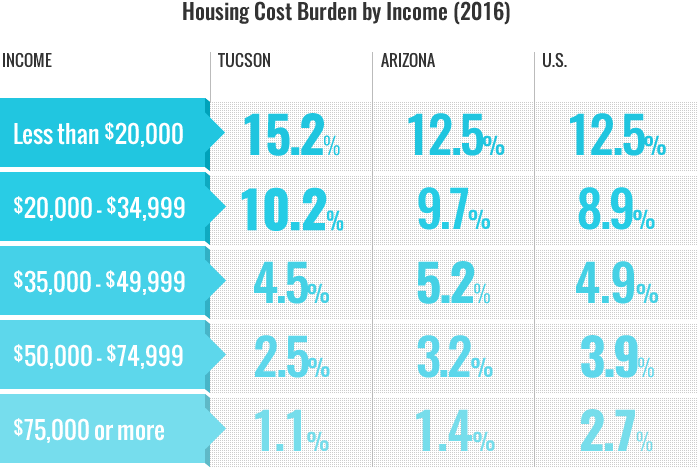
It is especially telling to break overall housing cost burden down by tenure and income. Homeowners in Tucson do pretty well relative to peer MSAs with only 24.2% paying more than 30% of their income in housing expenditures. On the other hand, renters in Tucson have a housing cost burden of nearly 53.0%, one of the highest among peer western MSAs. When exploring housing cost burden by income (Figure 4) those in the upper income brackets (which includes those earning the median family income) fare very well when compared to the state, nation, and peer western MSAs. However, residents that fall in the lower income brackets have a high housing cost burden when compared amongst their peers in other western MSAs and the nation.
Figure 4: Housing Cost Burden by Income
That leaves us with the paradox of high affordability and a high percentage of housing cost burdened households. Tucson is affordable for homeowners that earn the median family income but renters and those with wages in the lower income brackets experience a high level of cost burden when compared to peer MSAs. That begs the question: what are peer communities like Portland, San Diego, and Denver, which have a significantly lower percentage of cost burdened households at the lowest income level, getting right?
To hear more on these topics view the recent MAP Talk Webinar on Housing Affordability.


