 COVID-19 Drives Tucson's Unemployment Rate Up
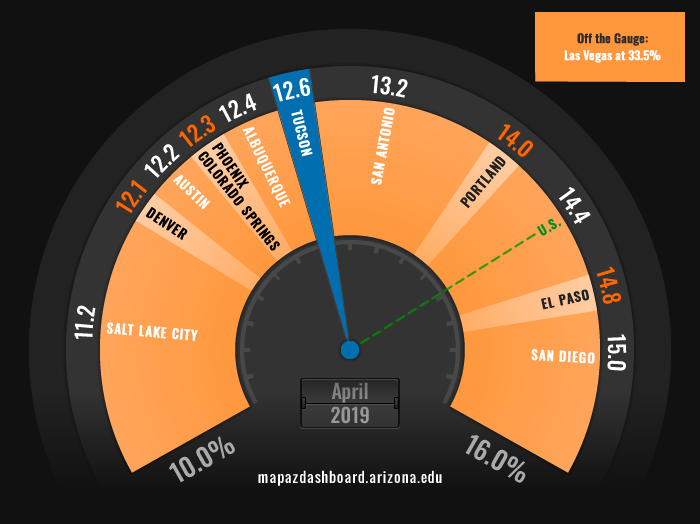
The COVID-19 pandemic has resulted in widespread health, social well-being, and economic consequences across the globe. In the United States, the non-seasonally adjusted (NSA) unemployment rate shot up to 14.4% in April. This was the highest NSA unemployment rate since the beginning of the current series in 1948. The Tucson Metropolitan Statistical Area (MSA) NSA unemployment rate in April was 12.6%, just slightly below the state’s rate of 12.9%. Tucson had the seventh-highest unemployment rate when compared to peer western MSAs (see Figure 1). Salt Lake City had the lowest at 11.2%, while Las Vegas had the highest at 33.5%. Las Vegas’s unemployment rate was more than double San Diego’s rate of 15.0%, which was the second-highest.
Figure 1: Non-Seasonally Adjusted Unemployment Rate (April 2020)
The high unemployment rate in Las Vegas was driven by the area’s industrial mix, which includes a large share of jobs in leisure & hospitality. The leisure & hospitality sector, which includes restaurants & bars, has been one of the hardest-hit industries across the nation. A recent MAP article “How Exposed are Tucson’s Industries to a COVID-19 Recession” explored the leisure and hospitality sector in detail for Tucson and its peer metropolitan areas. The article mentioned that Tucson’s leisure & hospitability sector accounted for 44,617 jobs or 11.2% of total employment in 2019. Figure 2 highlights the employment share in leisure & hospitality.
Figure 2: Employment Share of Leisure and Hospitality Industry (2019)
The NSA unemployment rate in Tucson increased to 12.6% in April of 2020, an 8.4 percentage point increase since February. The unemployment rate over the past year prior to the COVID-19 pandemic averaged 4.4%. In April, Tucson’s total employment was 434,139, a decline of 10.7% from February. This equated to a loss of 52,100 jobs. To put the employment losses in March and April in perspective during the entire 2008-2009 recession, Tucson posted job losses equal to 8.4% that occurred over three years. To learn more about long-term employment trends visit the Employment Growth indicator. As illustrated in Figure 3, Las Vegas’s unemployment rate increased the most between February and April, followed by San Diego. Albuquerque posted the smallest increase and Tucson’s increase fell in the middle of peers MSAs.
Figure 3: Non-Seasonally Adjusted Unemployment Rate
The economy is typically considered to be fully employed at an unemployment rate between four and five percent. A fully employed economy consists of a small percentage of unemployed individuals due to frictional and structural unemployment. Frictional unemployment is when workers and firms are actively searching for employment and employees. Examples of frictional unemployment include workers who move to a new town, those that leave their job willingly in search of a better job, and new graduates who are looking for a job. Structural unemployment happens when there is a skills gap between workers and the jobs available. Structural unemployment is commonly long-lasting and can be caused by fundamental changes in an economy, such as improvements in technology.
Stay tuned to the MAP for updated employment numbers as they become available. A great place to check often is our High Frequency COVID-19 related data page.


