Home prices in Tucson continue to steadily increase following a 2011 recession-induced low. As shown in Figure 1, the Tucson Metropolitan Statistical Area (MSA) had a 2017 median sales price of $210,300 for existing single-family homes: 14.8% less than Phoenix and 15.5% below the national median. When compared across 12 western metropolitan areas, Tucson had the third lowest median home price, higher than only El Paso and Albuquerque. San Diego had the highest median price for homes among peer communities at $599,000, which was the only median sales price in the comparison group that was more than double that of Tucson.
Figure 1: Median Home Price (2017)
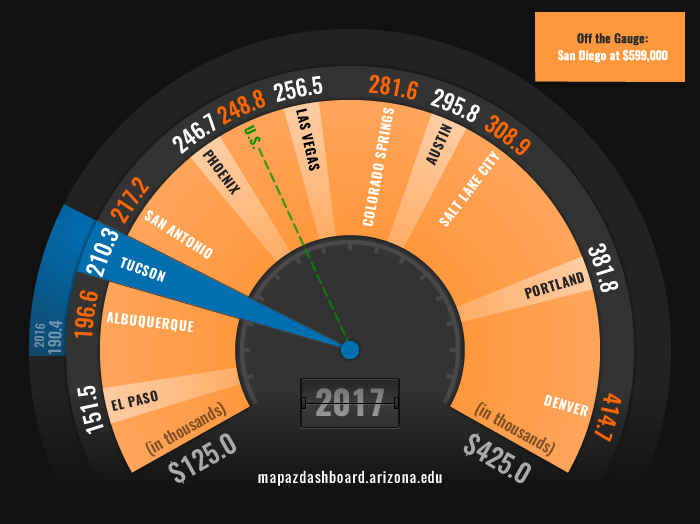
Several factors can influence home prices, including population growth, mortgage rates, and the business cycle. For example, population growth in Tucson is lower than most of its peer western MSAs (with the exception of San Diego). However, Tucson's median home price is substantially more affordable to those earning the local median family income when compared to the nation and Phoenix. Visit MAP's new indicator on Housing Affordability and the recent feature article on Rental Affordability to learn more about how affordable housing is in Tucson.
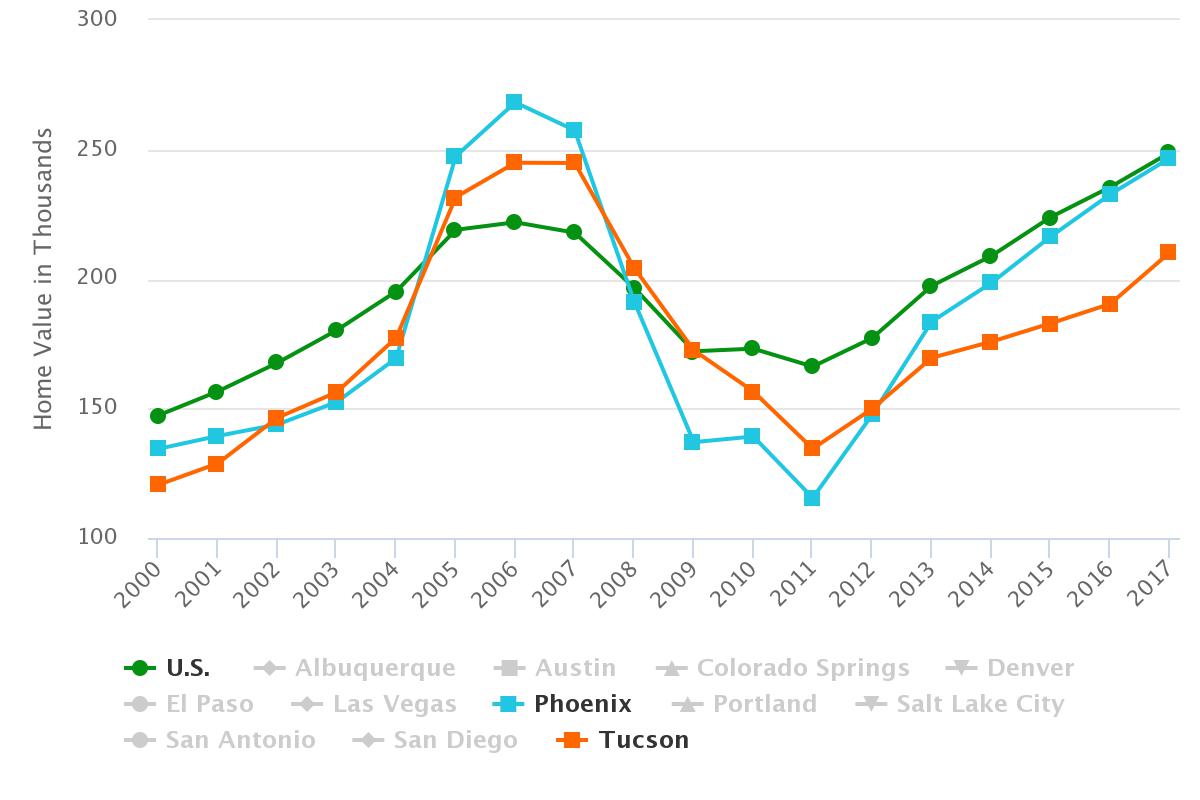
While Tucson price fluctuations were more noticeable than those of the nation in the recent past, they were not nearly as volatile as prices in Phoenix. A distinct rise in nationwide home prices began around 2004, peaking in 2006, then undergoing a sharp decline. The current median home price increases began after prices bottomed out in 2011. While the U.S. and some western MSA housing markets have surpassed their pre-bubble price level, Tucson has not. For example, Tucson’s median home price decreased to $134,500 in 2011 from a $244,900 peak in 2006; median home price has since risen by 56.4% to $210,300, but is still below the 2006 peak. Since the 2011 low point, Phoenix home prices have increased by 113.6%, but like Tucson, have not yet caught up to the pre-downturn high point. Comparatively, national home prices followed the same rise and fall, but have since exceeded the 2006 housing price peak, as have seven of the 12 western comparison MSAs (see Figure 2).
Figure 2: Median Home Price Trend
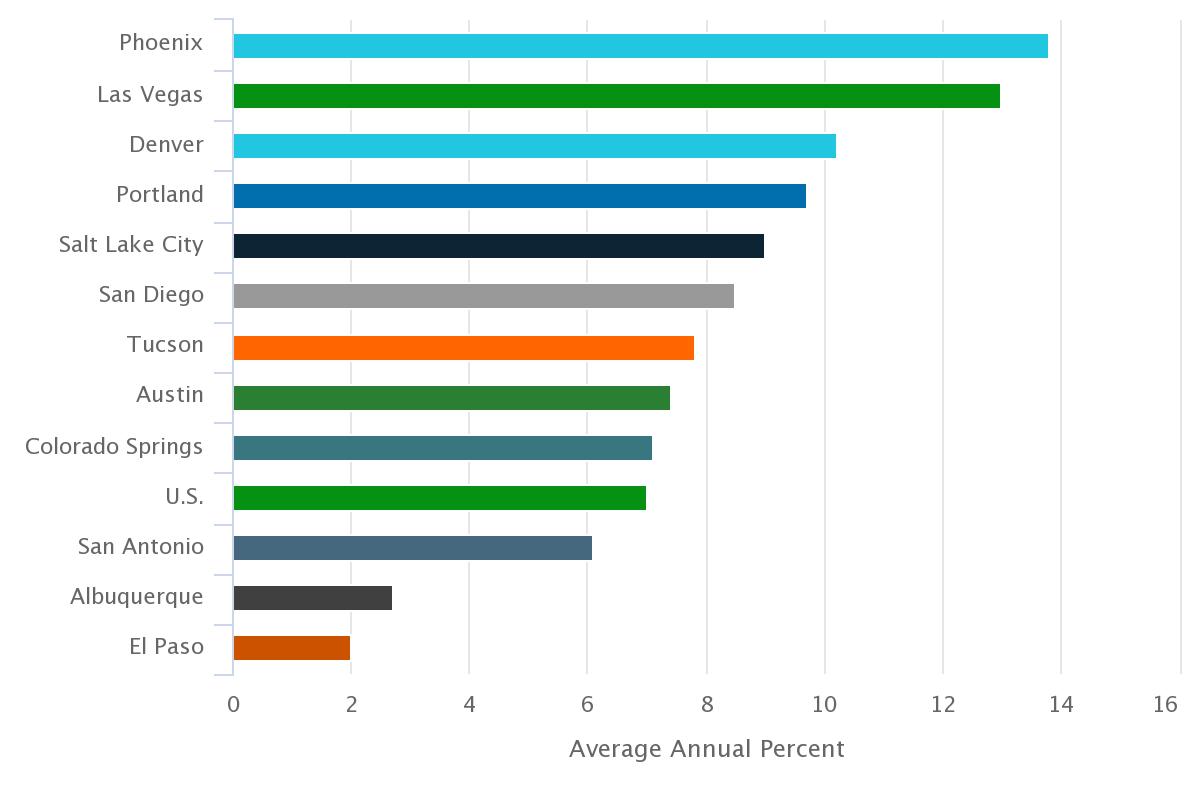
Since 2011, Tucson has exceeded the national growth rate, on average, with a steady upward trend in home prices, although not yet achieving the 2006 price peak. Ranked seventh in the comparison group, Tucson home prices increased at a slower rate than many of its peer MSAs from 2012-2017, while Phoenix leads the group with an average home price growth rate of 13.8% in this time period. El Paso and Albuquerque have the lowest growth rates among peer western MSAs, with both metros having less than 3.0% average growth from 2012-2017 (see Figure 3).
Figure 3: Average Annual Growth Rate in Home Price by MSA (2012-2017)
Despite the unpredictable short-term price fluctuations real estate markets experienced in the recent past, National Association of Realtors (NAR) data shows that the price of existing homes increased by about 5.4% annually from 1968-2009, on average. Using the 18 years of data available for Tucson and its comparison MSAs, Figure 4 shows similarly modest annual growth rates, on average, in four different time periods including the last 18 years (2001-2017), the pre-bubble period (2001-2006), the downswing (2006-2011), and the current recovery period (2012-2017). In fact, only two cities in the western MSA comparison group even slightly exceed the longer-term growth benchmark with Las Vegas experiencing 5.5% and San Diego undergoing 5.8% average annual home price growth in the last 18 years.
In the same period, Tucson’s home price increased 4.0% annually, on average, despite the recession-induced downswing. Comparatively, Tucson's home prices increased 12.9%, on average, during the six-year period leading up to the housing bubble and are now growing at 7.8% on average annually in the six-year post-recession period. While Tucson’s median home price is appreciating at a slower rate now than during the 2001-2006 period before the housing bubble, this is not true for all the comparison MSAs. There are six western MSAs growing faster in the current recovery period than before the housing bubble, including Phoenix, which is growing at 13.8% in the post-recession period compared to 13.1% on average growth during the 2001-2006 period. Notably, these same fast-growing MSAs did not suffer any more than a 1.5% decline during the recession period, with the exception of Phoenix. (Graphs available for other geographies upon request.)
Figure 4: Average Annual Growth Rate in Home Prices for Select Time Periods
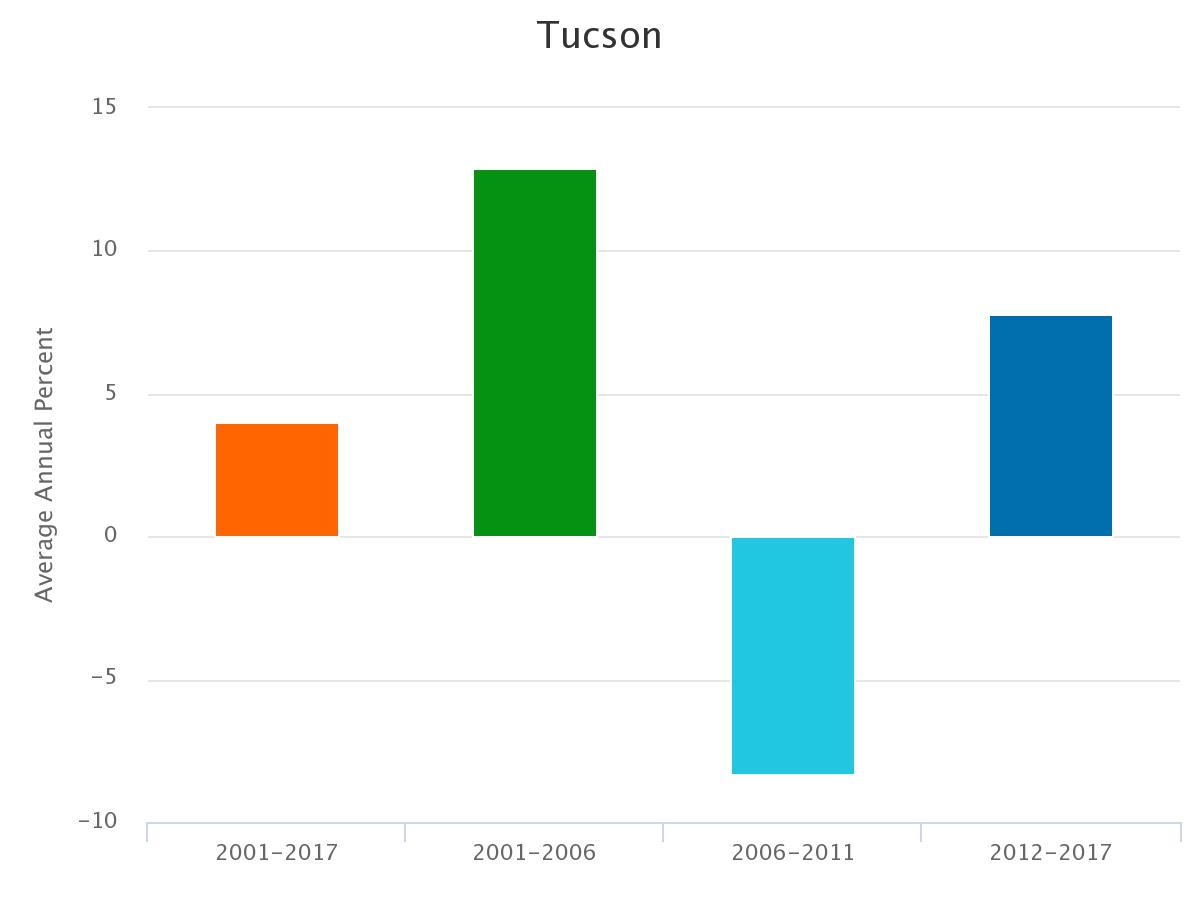
Note regarding time periods shown in Figure 4: 2001-2017 is the last 18 years; 2001-2006 is the pre-bubble period; 2006-2011 is the downswing; and 2012-2017 is the current recovery period.
Median home price represents the sales price of existing single-family homes. The median price is the amount that divides the price distribution into two equal groups: half the homes sold are above the median price and half are sold at a price below the median. These data come from the National Association of Realtors (NAR), which tracks and compiles existing home sales from local associations/boards and multiple listing services nationwide. The NAR differs from other measures that are designed to track repeat sales, such as the Federal Housing Finance Agency (FHFA) or S&P/Case-Shiller home price indexes, in that median home price can be strongly influenced by the mix of houses sold in an area.


