How affordable is housing in Tucson? It depends on who you ask and what data you explore. In this article we review the key measures of affordability and what they mean for the Tucson region. Further, we will explore how the Tucson Metropolitan Statistical Area (MSA) compares to similar regions around the western U.S.
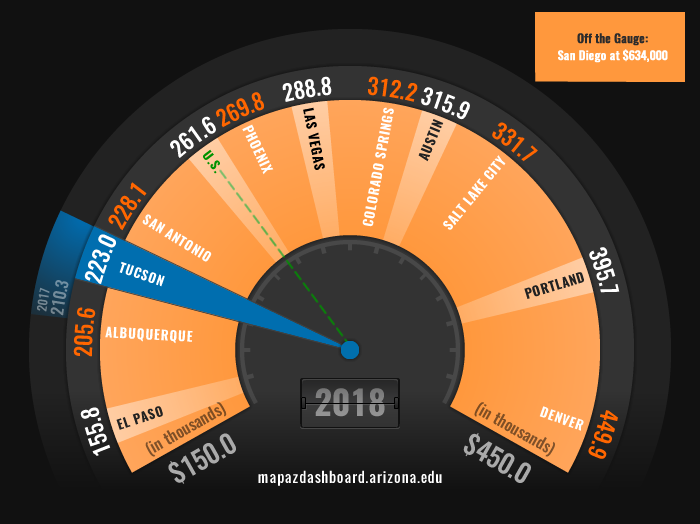
In 2018, the median price of a single-family home in the Tucson MSA was at an eleven-year high and up 6.0% over last year. While prices have steadily increased since the Great Recession, Tucson continues to have one of the lowest median home prices when compared to peer western MSAs. Home prices reflect supply and demand in the housing market which echoes, in part, the general economic health of a region. Home prices also influence how much discretionary income residents have to spend in other areas such as childcare. When it comes to affordability, home prices only tell part of the story. The income of the local residents is equally as important. Figure 1 illustrates the median home price for Tucson and peer MSAs. To learn more about how home prices in Tucson are trending visit the recent article “Home Prices Continue to Rise”.
Figure 1: Median Home Price

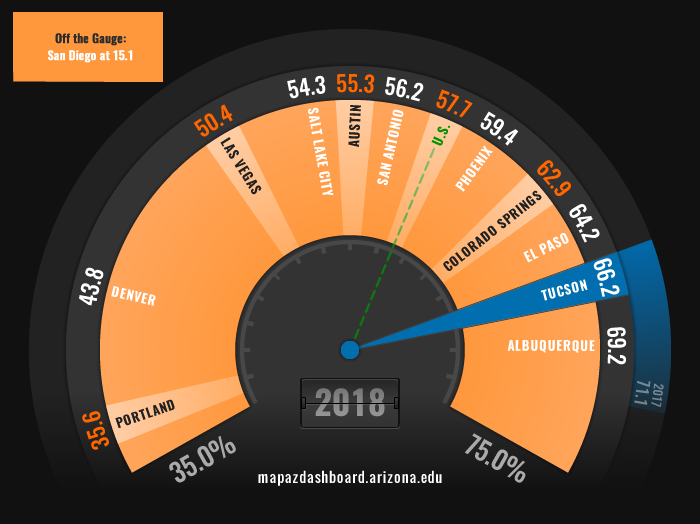
The MAP Dashboard reports two measures of affordability, one for homeowners and one for renters. The indicator Housing Affordability explores how affordable recently sold single-family homes are to someone earning the local median family income. In 2018, the median family income in Tucson was $60,000. This measure assumes that a family can afford to spend 28% of its gross income on housing. Tucson ranks second in housing affordability among peer western MSAs with 66.2% of homes sold in 2018 affordable to those earning the median family income (see figure 2). While Tucson’s affordability for homeowners has remained high among peer western MSAs it has decreased substantially over the past few years as home prices have increased faster than wages.
Figure 2: Housing Affordability Index (2018)

What does this mean for renters or those that earn less than the median family income? The MAP recently published a feature article "Affordable Tucson: How Do Renters Fare" that explores data published by the New York University (NYU) Furman Center on rental affordability. Unfortunately, renters in Tucson do not fare as well as homeowners when compared among peer MSAs in terms of affordability. As figure 3 illustrates, Tucson ranks second to last with 76.2% of available properties in 2015 considered affordable.
Figure 3: Share of Affordable Rentals for Those Earning the Local Median Household Income (2015)
[[nid:25431]]
It is important to note the difference in income measures used to calculate homeowner versus rental affordability. Housing affordability uses median family income, which consists of more than one person in the household related by birth, marriage, or adoption. Rental affordability calculations utilize median household income, which covers all households, including those with persons living alone or multiple unrelated individuals. These households tend to have a large percentage of young or old individuals. Family income is typically higher than household income. This is an important distinction particularly for Tucson, given the high percentage of retirees and college age students. In 2017, median family income was nearly $12,000 higher than median household income for Tucson.
So far we have illustrated how those median income earners fare among different housing affordability measures, but what about those in the lower income brackets. How affordable is housing in Tucson for them? In addition to the affordability measures, the MAP explores Housing Cost Burden for renters and owners, and by income. The income breakdown paints a very different picture for those in the lower and upper brackets especially relative to peer western MSAs.
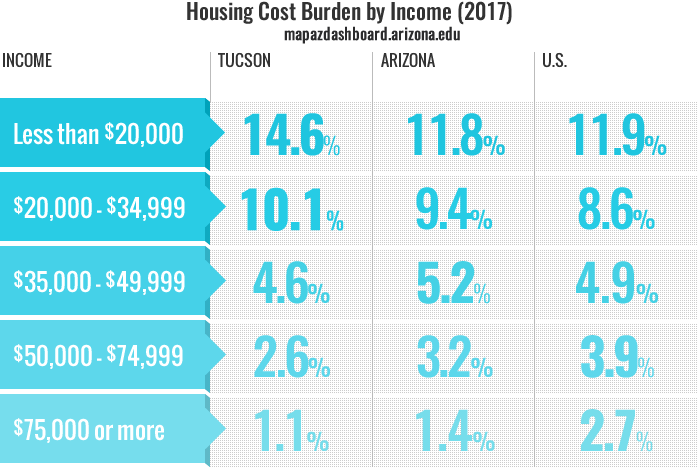
Overall, the Tucson MSA ranked ninth among peer western MSAs in the percent of cost burdened households in 2017. A household is considered cost burdened when they spend more than 30% of their income on housing expenditures (including utilities). What is especially telling is when we break overall housing cost burden down by tenure and income. Overall, homeowners in Tucson do pretty well relative to peer MSAs with only 23.4% paying more than 30% of their income in housing expenditures. On the other hand, renters in Tucson have a housing cost burden of nearly 53%, one of the highest among peer western MSAs. When exploring housing cost burden by income (see figure 4) those in the upper income brackets (which includes those earning the median family income) fare very well when compared to the state, nation, and peer western MSAs. However, those that fall in the lower income brackets have an exceptionally high housing cost burden when compared amongst their peers in other western MSAs and the nation.
Figure 4: Housing Cost Burden by Income

One component of housing cost burden is monthly housing cost. The Joint Center for Housing Studies at Harvard University reports median monthly housing costs for owners and renters. The monthly housing costs for owners includes mortgage payments, property taxes, insurance, utilities, and condo/mobile home fees (if any), while costs for renters include rent and utilities. In Tucson, the median monthly housing cost for homeowners and renters is relatively low when compared to peer western MSAs. In 2017, the median monthly cost for a renter in Tucson was $880, while the monthly cost for a homeowner was slightly higher at $924. Figure 5 illustrates how Tucson compares in median monthly costs for homeowner and renters relative to peer MSAs. It is important to note that while monthly costs comparisons are interesting they are only part of the equation. The cost of living in a region and amount of income must also be taken into account to reflect affordability.
Figure 5: Median Monthly Costs (2017)
[[nid:25428]]
In summary, the Tucson region has relatively low home prices and monthly housing costs for homeowners and renters. However, prices and costs are only part of the story. The income of renters and homeowners is equally important. When factoring in income, we find that Tucson is affordable for homeowners that earn the median family income, however renters and those with wages in the lower income brackets experience a high level of housing cost burden when compared to peer MSAs. That begs the question, how do peer communities like Portland, San Diego, and Denver have a significantly lower percentage of cost burdened households at the lowest income level? One of many reasons may be that wage earners in the 10th and 25th percentile for those regions earn more. You can learn more about wages for Tucson and its peer metros in the indicator Wage Distribution.


