How are we doing?
Employment in Arts, Entertainment, and Recreation per 10,000 Residents (2014)
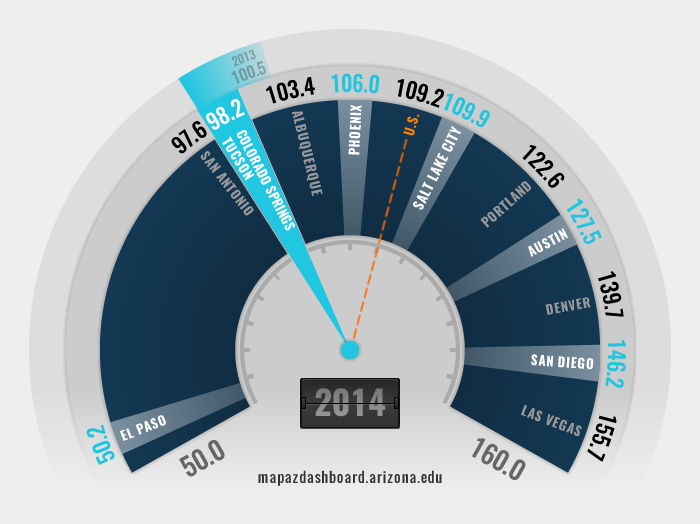
The Tucson Metropolitan Statistical Area (MSA) posted a rate of 98.2 workers per 10,000 residents in the arts, entertainment, and recreation employment categories in 2014. This tied Tucson MSA with Colorado Springs for 9th out of 12 western MSAs, just below Albuquerque at 103.4 workers, and above San Antonio (97.6) and El Paso (50.2). Not surprisingly, the Las Vegas MSA ranked first at 155.7, followed by San Diego and Denver with 146.2 and 139.7 workers, respectively.
[[nid:11127]]
Arizona ranked eighth out of 10 western states in these leisure categories, with 98.1 employees per 10,000 residents, which is 10.7% lower than the 2014 national average of 109.2 workers. Between 2007 and 2014, the rate of employment in these categories fell by 19.8% in Tucson and 8.5% in Arizona, reflecting the Great Recession, while the rate for the nation increased slightly by 5.2%.
Why is it important?
The number of workers per 10,000 residents in the arts, entertainment, and recreation employment categories provides a gauge of leisure opportunities available to both residents and visitors. As such, higher concentrations of employment in these recreational categories can improve the quality of life of the populace while generating economic activity in the form of tourism. These businesses also can provide a larger tax base for state and local governments through additional sales and employment.
What are the key trends?
For most of the period between 2002 and 2014, the Tucson MSA enjoyed higher levels of employment in the arts, entertainment, and recreation than Arizona and the nation. Tucson only recently slipped below the U.S. rate in 2012. Between 2007 and 2014, employment in these leisure categories declined by 19.8% in Tucson and 8.5% in Arizona. The national rate increased by 5.2% during this same period, thus recreational employment is another area in which Arizona suffered more than the national economy following the Great Recession.
[[nid:769]]
How is it measured?
The data come from the Census Bureau’s County Business Patterns, as well as the Census Bureau’s Nonemployer Statistics. The County Business Patterns capture most economic activity by measuring payrolls at employment establishments. The Nonemployer Statistics are used to supplement these data by tallying the number of businesses that have no paid employees, but are still subject to federal income tax (mostly sole proprietorships), which captures self-employed persons in the arts, entertainment, and recreation categories who are not reflected in the County Business Patterns. The data also represent the definition for the North American Industry Classification System (NAICS) employment code 71: Arts, Entertainment, and Recreation.


