How are we doing?
Percent of Other Principal Arterial Roads Rated Good (2015)
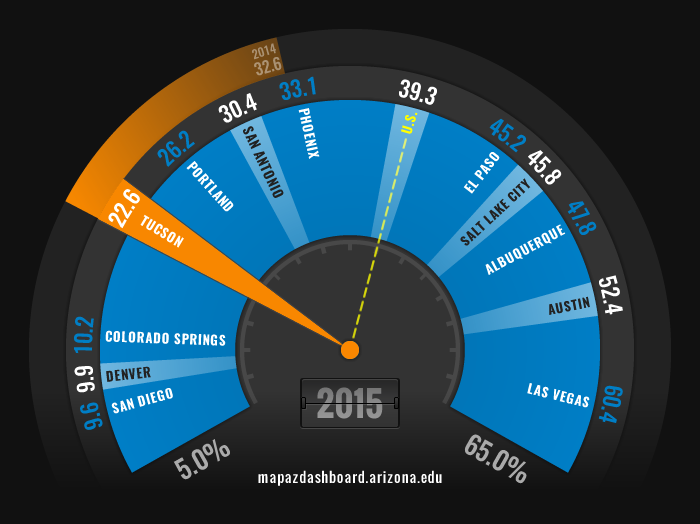
In 2015, 22.6% of other principal arterial roadways in the Tucson urban area had a good rating, indicating a high degree of smoothness on those roads. This ranked Tucson ninth among comparable urban areas in the west. The Las Vegas urban area ranked first with 60.4% of other principal arterials rated good, while San Diego and Denver ranked at the bottom with less than 10.0% rated good. Tucson reported a substantial decline in the percentage of other principal arterials rated good during the past year.
Other principal arterials are particularly important to the Tucson urban area because they account for a relatively large share of vehicle miles traveled in the region, nearly 40.0%. Other principal arterials are heavily used urban roads that collect traffic from intersecting residential streets, and direct it toward employment or business centers, and freeways and interstates. Examples of other principal arterials in the Tucson urban area are Grant Road and Broadway Boulevard.
Why is it important?
Pavement quality plays a vital role in traffic safety and commuter comfort. When roads wear out, they must be rehabilitated and resurfaced to maintain smooth, safe driving conditions. Deteriorated roads also increase user costs, which over time can amount to a significant financial burden on the traveling public. Proper maintenance lengthens the useful life of a roadway, maximizes traffic safety, and minimizes repair costs for road users. Research has found that pavement roughness increases the likelihood of traffic accidents (Chan, et. al. 2010; Bester, S. 2003; Anastasopoulos, et. al. 2012). For example, rough pavement decreases skid resistance, reducing motorist control under adverse driving conditions.
Numerous factors influence pavement quality including funding, climate, jurisdictional boundaries, and user characteristics. Most funding for federal-aid highways is distributed to states by the federal government, using formulas based on population levels, historical funding amounts, and each state’s relative contribution to the Highway Trust Fund. The federal government reimburses states and urban areas for about 80% of transportation project expenditures, and the remaining 20% is financed by local governments through taxes, bonds, and private contributions. Local governments have flexibility over which projects are considered for funding and can improve road quality by advancing more maintenance related projects for consideration.
How do we compare?
Nearly 30.0% of major roads in the Tucson urban area were classified in poor condition during 2015. Major roads include interstates, other freeways & expressways, and other principal arterials combined. An additional 23.0% were in mediocre condition, 15.2% were rated fair, and 34.5% were classified as good. When compared among 12 western urban areas, Las Vegas had the lowest percentage of roadways rated poor at 3.3%, while San Diego fell just above Tucson with 22.7% of roads rated poor. Tucson was significantly behind the U.S. and Phoenix at 13.7% and 10.5% respectively. Figure 1 highlights road conditions for all major roadways.
Figure 1: Percentage of roadway conditions for the total (combined roadway type) 2015
Pavement quality varies significantly by the type of roadway, as the figure below shows. For example, 34.5% of other principal arterials in the Tucson urban area rated in poor condition in 2015. In contrast, less than 1.0% of interstates were in poor condition, the least amongst comparable western urban areas. San Diego ranked last in pavement quality for other principal and minor arterials. Las Vegas reported the lowest percentage of other principal arterials rated poor and the third lowest percentage of poorly rated minor arterials.
Figure 2: Percent Rated Poor by Road Type for Urban Areas (2015)
Pavement quality impacts motorists on the roads they use often. In 2015, 36.8% of vehicle miles traveled (VMT) on major roads in the Tucson urban area were on other principal arterials, such as Grant Road. Minor arterials, such as Tucson Boulevard, had a slightly higher volume of vehicle miles traveled than other principal arterials at 38.3%, while freeways & expressways (Aviation Highway) and interstates were significantly lower at 2.0% and 22.9% respectively.
Among 12 western urban areas, Tucson had the highest percentage of vehicle miles traveled on both minor and other principal arterials. Tucson ranks near the bottom in the percentage of VMT on interstates, which tend to be in better condition than minor and other principal arterials. Salt Lake City and San Diego had the largest share of VMT on interstates at nearly 50.0%. Phoenix had the lowest share traveled on interstates at 15.0% but one of the largest share traveled on other freeways & expressways at 27.9%.
Figure 3: Percentage of vehicle miles traveled by road type for urban areas (2015)
What are the key trends?
The percent of other principal arterials rated poor has varied significantly since over the past few years in the Tucson urban area. Road conditions have improved since 2012 when nearly 40.0% of other principal arterials had a poor rating. However, road conditions on other principal arterials are not as good as in 2014 when only 26.1% were classified as poor. During the same time, Phoenix posted an increase in the percentage of other principal arterials rated poor from only 6.0% in 2012 to 19.6% in 2015. The U.S. urban areas saw a sharp decline in the percent of other principal arterials rated poor decreasing by nearly nine percentage points over the last four year.
Figure 4: Percent of Other Principal Arterials Rate Poor Trend (2012-2015)
How is it measured?
Federal Highway Administration (FHWA) data on pavement roughness by state and urban area are reported as the International Roughness Index (IRI) in inches per mile. The IRI is computed by dividing accumulated vehicle suspension motion in inches by the distance traveled in miles. Suspension vibration is gauged with a sensor installed in the wheelbase of a standard vehicle. IRI data are reported for the type of road, such as interstate, other freeway & expressway, other principal arterial, and minor arterial. Lower scores indicate smoother pavement. An IRI score of less than 95 is considered good, while roads with ratings 170 or more are considered poor and in need of repair. Scores between 95 and 119 indicate roads in fair condition while scores between 120 and 169 represent roads in mediocre condition.
Federal-aid urbanized areas include, at minimum, a census designated place with an urban population of 5,000 to 49,999, or a census designated urban area with a population 50,000 or more. Boundaries of federal-aid urban areas may be adjusted to reflect urbanization and transportation needs. Accordingly, they may include densely settled urban areas adjacent to the census designated urban area, as approved by the U.S. Department of Transportation. Urban areas differ from metropolitan statistical areas, which are comprised of counties that contain an urban area, as well as adjacent counties that meet certain population density and connectivity requirements.
Note that some minor arterial data has been excluded from the MAP Dashboard graphs due to inconsistencies in the data.
References:
Anastasopoulos, P. C., Mannering, F. L., Shankar, V. N., & Haddock, J. E. (2012). A study of factors affecting highway accident rates using the random-parameters tobit model. Accident Analysis & Prevention, 45, 628-633. See. p. 631
Bester, C. J. (2003, January). The effect of road roughness on safety. In TRB 2003 annual meeting.
Chan, C. Y., Huang, B., Yan, X., & Richards, S. (2010). Investigating effects of asphalt pavement conditions on traffic accidents in Tennessee based on the pavement management system (PMS). Journal of advanced transportation, 44(3), 150-161. See pp. 157-158


