Hispanic business owners play a vital, and increasing, role in the economy of the western U.S., specifically in Border States such as Arizona, New Mexico, Texas, and California. The pattern in Arizona reflects the prominence of Hispanic-owned businesses in the southern portion of the state. Hispanic-owned firms tend to be small businesses with less than 10 employees, often a self-employed individual, and are more likely to be headed by women compared to other businesses.
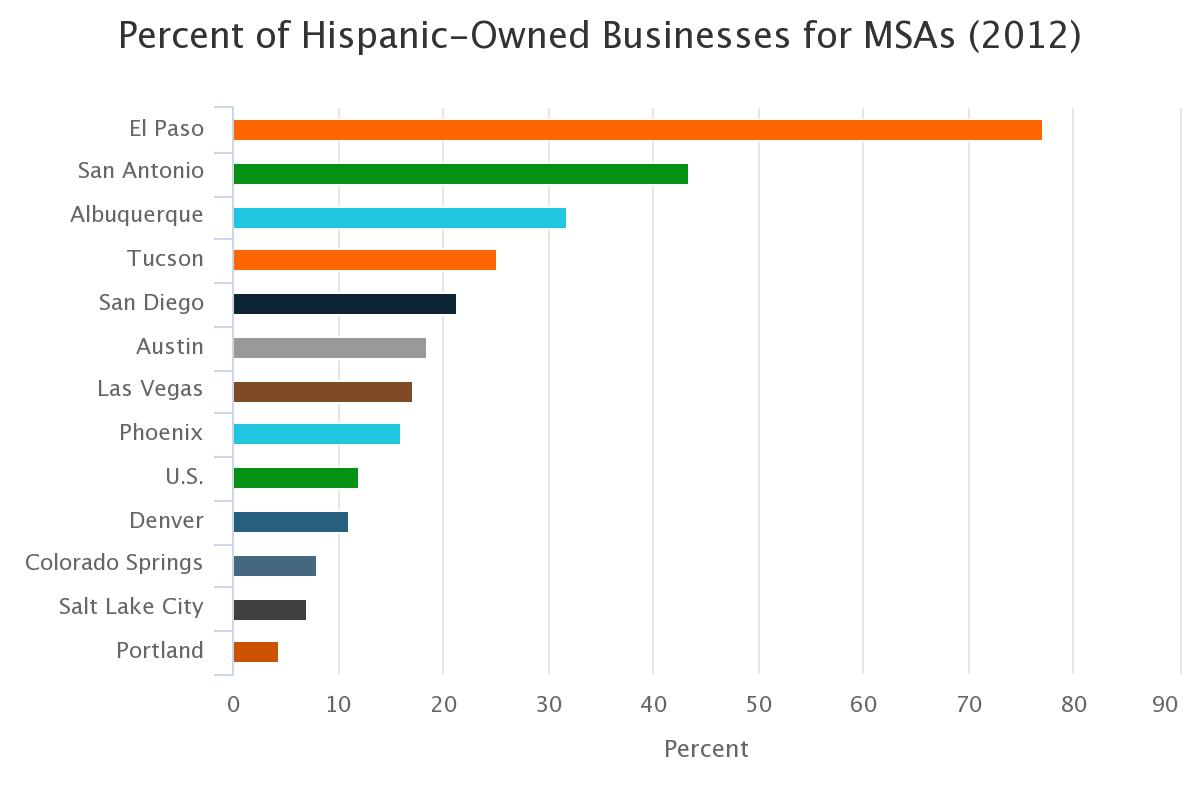
A quarter of all businesses in Tucson were Hispanic-owned in 2012, according to the most recent Survey of Business Owners. Among the MAP Dashboard metropolitan areas, Tucson’s 25.2% placed it fourth in the percent of businesses owned by Hispanics. El Paso had the highest percent by far, at 77.1%, followed by San Antonio at 43.3%, then Albuquerque at 31.7%. Denver, Colorado Springs, Salt Lake City, and Portland all had a smaller percentage of Hispanic-owned businesses than the nation as a whole, which was 12.0%.
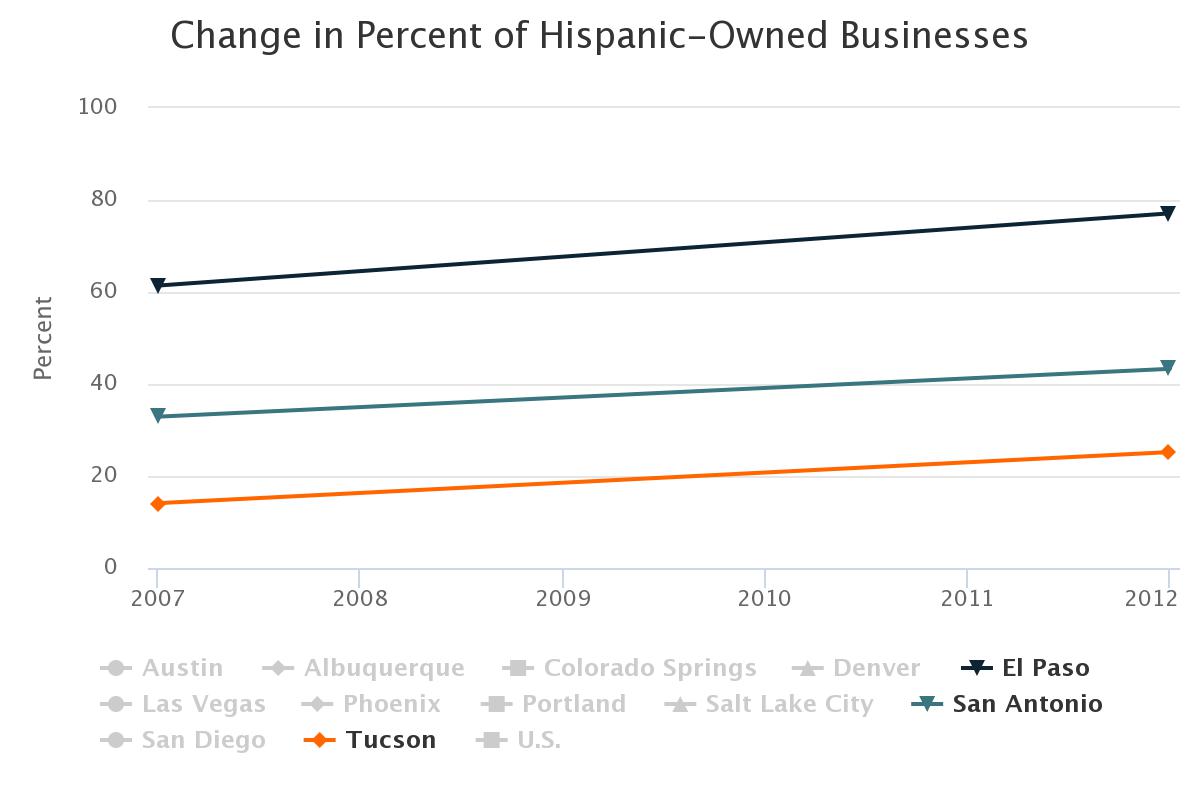
Tucson was one of three metropolitan areas to have a double-digit increase in the percentage of businesses owned by Hispanics, moving up from 14.1% in 2007 to 25.2% in 2012. El Paso posted the largest increase at 15.7 percentage points while San Antonio increased by 10.4.
There were 89,383 Hispanic-owned businesses in Arizona in 2012, representing 17.9% of all businesses in the state. Arizona ranked fourth among the states explored on the MAP Dashboard, and was nearly 6 percentage points above the nation. New Mexico had the highest percentage of Hispanic-owned businesses in the country with a rate of 30.7%. The percent of firms that were Hispanic-owned grew in every state between 2007 and 2012, with Arizona increasing 7.2 percentage points from 10.7% to 17.9%.
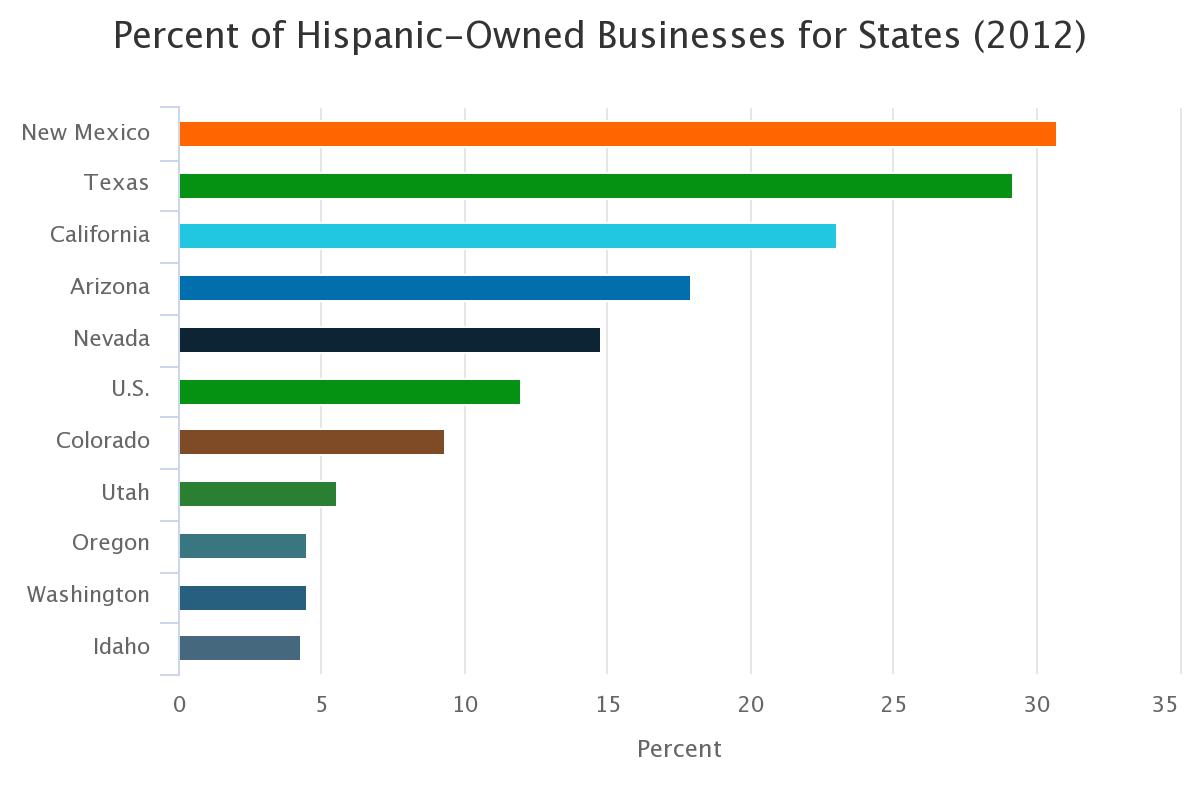
While New Mexico had the largest percent of Hispanic-owned businesses in the nation in 2012, California, followed by Texas and Arizona, had the largest number of Hispanic-owned businesses in the U.S. California also had the highest amount of revenue from Hispanic-owned businesses in the nation. Arizona was fourth out of all MAP states, and eighth out of all states, in terms of revenue.
| All firms | Hispanic-owned firms | |
|---|---|---|
| United States | 27,626,360 | 3,305,873 |
| Arizona | 499,926 | 89,383 |
| California | 3,548,449 | 815,304 |
| Colorado | 547,352 | 51,141 |
| Idaho | 146,642 | 6,265 |
| Nevada | 227,156 | 33,678 |
| New Mexico | 151,363 | 46,477 |
| Oregon | 339,305 | 15,437 |
| Texas | 2,356,748 | 687,570 |
| Utah | 251,419 | 13,735 |
| Washington | 541,522 | 24,440 |
Among Arizona counties, those in the southern portion of the state had the highest percent of Hispanic-owned businesses, as the map shows. Santa Cruz, at 67.6%, was predominately Hispanic-owned, while Coconino had the smallest percentage at 5.6%. Statistics for several of the smaller counties were suppressed in 2007, so trend data are not available.

Types of businesses owned by Hispanics
Most Hispanic-owned businesses were very small, having only an owner and no employees. Nationally, 91.3% of Hispanic-owned businesses were self-employed enterprises. Texas, Nevada, Arizona, and California had the lowest percent of Hispanic-owned businesses that employed workers, while Oregon, Washington, and Idaho had the highest percent. Those that did have employees typically had less than 10, as the U.S. average was 8 employees.
Hispanic-owned firms were also more likely than others to be headed by women. Table 2 shows the total percent of firms that were primarily owned by females, as well as the percent of Hispanic-owned firms owned by females. The percent for Hispanic-owned firms was higher in each instance, and at 46.7%, Arizona had the highest percent of Hispanic businesses owned by women among states listed on the MAP Dashboard.
| All firms | Hispanic-owned firms | |
|---|---|---|
| United States | 35.8 | 44.5 |
| Arizona | 36.5 | 46.7 |
| California | 37.2 | 44.8 |
| Colorado | 35.5 | 44.8 |
| Idaho | 30.8 | 41.2 |
| Nevada | 36.3 | 45.8 |
| New Mexico | 39.0 | 43.7 |
| Oregon | 36.3 | 45.6 |
| Texas | 36.8 | 42.2 |
| Utah | 30.3 | 44.7 |
| Washington | 34.7 | 46.1 |
Hispanic-owned firms were most likely to be represented in four industry sectors across all geographies. Top industries for the U.S., in order of prominence, were: other services, administrative and support and waste management, construction, and finally health care and social assistance. The list was the same for Arizona, with administrative and support and waste management trading places with other services. One of these four sectors was the primary industry for Hispanic-owned businesses in all of the MAP Dashboard metropolitan areas.
‘Other services’ covers businesses such as repair and maintenance, like automotive, machinery or furniture repair, as well as personal services like hair and nail salons, dry cleaners, and funeral homes. ‘Administrative and support and waste management’ includes such businesses as bookkeeping, janitorial, landscaping, guard and security, call centers, collection agencies, travel agencies, as well as waste collection and treatment.
Source of data
The Census Bureau conducts the Survey of Business Owners in conjunction with the Economic Census every five years (those ending on a 2 or a 7). It is a sample survey that provides information selected economic and demographic characteristics for businesses and business owners by gender, ethnicity, race and veteran status. Businesses categorized as Hispanic-owned refer only to businesses that self-identify 51% or more of their ownership to be by individuals of Hispanic origin. Likewise, women-owned businesses (Hispanic-owned or otherwise) have a woman owning 51% or more of the equity, interest, or stock of the business. These data were released in December 2015.


