Tucson's Slow Job Recovery
Tucson jobs plummeted in the spring of 2020, as the pandemic caused disruptions across major sectors of the economy, as Figure 1 shows. With the lifting of the stay-at-home order, jobs bounced back strongly initially but then settled into a more gradual recovery. As of April 2022, Tucson jobs were 5,300 below their pre-pandemic peak.
Figure 1: Tucson MSA Total NonFarm Payroll Jobs, Seasonally Adjusted, Thousands
One way of thinking about Tucson’s job recovery is to calculate the job recovery rate. This is just the ratio of job growth from April 2020 to April 2022 divided by the job loss from February to April of 2020. A value of 100% indicates that all of the jobs lost during the first two months of the pandemic have been restored.
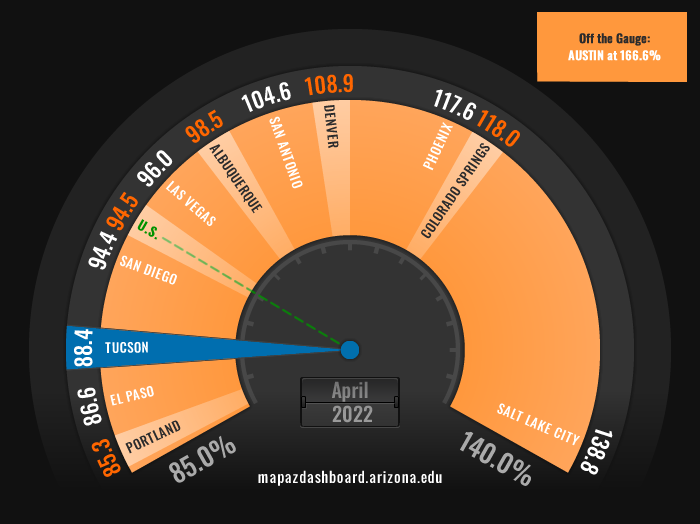
Figure 2 shows Arizona job replacement rates by metropolitan area, as well as the state and the nation. As the figure shows, Tucson lost 45,500 jobs from February to April of 2020. Since April 2020, Tucson has added back 40,200 jobs for a job replacement rate of 88.4%. That was below the national rate and well below the recovery rates for the state as a whole and most metropolitan areas in the state.
The current estimates suggest that four of the state’s seven metropolitan areas have replaced all of the jobs lost during the February to April 2020 period: Lake Havasu City-Kingman, Phoenix, Prescott, and Yuma. As of April 2022, Sierra Vista-Douglas replaced 63.6% of the jobs lost early in the pandemic, Tucson replaced 88.4%, and Flagstaff replaced 92.2%.
Figure 2: Arizona Job Replacement Rates, Seasonally Adjusted
| Area | Jobs Lost, Feb-Apr 2020, Thous. | Jobs Gained, April 2020 - April 2022, Thous. | Replacement Rate, April 2022 (%) |
|---|---|---|---|
| Flagstaff | -12.8 | 11.8 | 92.2% |
| Lake Havasu City-Kingman | -6.1 | 8.3 | 136.1% |
| Phoenix | -249.7 | 293.6 | 117.6% |
| Prescott | -8.9 | 10.4 | 116.9% |
| Sierra Vista- Douglas | -2.2 | 1.4 | 63.6% |
| Tucson | -45.5 | 40.2 | 88.4% |
| Yuma | -5.9 | 6.4 | 108.5% |
| Arizona | -338.7 | 387.4 | 114.4% |
| U.S. | -21,991.0 | 20,779.0 | 94.5% |
Figure 3 shows that Tucson’s job recovery rate was also slow compared to the 11 other western metropolitan areas tracked on the MAP.
Figure 3: Job Recovery Rates for Selected Western Metropolitan Areas
The job recovery has been very different across industries in Tucson. Figure 4 shows the change in Tucson MSA jobs by industry from February 2020 to April 2022. Professional and business services jobs were still down by 5,900, followed by government (down 4,600), information (down 1,000), educational and health services (down 900), leisure and hospitality (down 700), construction (down 400), and other services (down 200).
In contrast, trade, transportation, and utilities jobs were 7,500 above their February 2020 level, driven primarily by gains in transportation and warehousing. The growth in transportation and warehousing reflects the shift to online-shopping and increased use of delivery services that accelerated during the pandemic. Financial activities jobs were up 1,000 by April 2022. Manufacturing jobs were up by 100 and natural resources and mining jobs were back to their pre-pandemic peak.
Figure 4: Tucson MSA Jobs by Industry, Change from February 2020 to April 2022, Thousands, Seasonally Adjusted
Figure 5 shows jobs by industry in April 2022 relative to February 2020 for Tucson, Arizona, and the U.S. If the ratio is less than one, then jobs in April 2022 are below their February 2020 level. For Tucson, jobs in eight out of 11 industries were still below their pre-pandemic level, which was more than the state and nation, at six each.
As we would expect from the results for total jobs, many industries in Tucson were further below their February 2020 level than we see for the state and the nation. This is particularly important for professional and business services, which was still only 88.3% of its pre-pandemic level in Tucson, in contrast to full recovery for the state and the nation.
Professional and business services matters because it is a major employment sector, with 50,500 jobs in 2019. Professional and business services includes a variety of sectors, including professional, scientific, and technical services; administrative and support and waste management and remediation services; and management of companies and enterprises. Professional, scientific, and technical services includes accountants, lawyers, engineers, and computer scientists (among other activities). Administrative and support and waste management and remediation (ASWMR) services includes a wide range of activities including call centers, employment agencies, document and waste disposal, and building services (like cleaning).
The U.S. Bureau of Labor Statistics does not provide full detail for the components of professional and business services, but it does publish non-seasonally adjusted monthly estimates for professional, scientific, and technical services (up 600 jobs from February 2020 to March 2022), and ASWMR services (down 7,400). Within ASWMR, jobs in employment services were down 1,900 and jobs in business support services (which includes call centers) were down 3,200. Part of the remaining job losses may be in services to buildings and dwellings (cleaning, etc.) which were reduced during the pandemic.
Figure 5: Jobs by Industry, April 2022 Relative to February 2020, Seasonally Adjusted, Percent
Tucson's Labor Market is Tight, But Labor Force Participation Lags
While Tucson jobs have not yet fully recovered, the number of employed residents did, if only briefly, recover late in 2021 (Figure 6). The data for employed residents come from a monthly survey of households and include residents with jobs as well as the self-employed, unpaid workers in family businesses, and farmers. The data on total nonfarm payroll jobs counts jobs on the payrolls of firms each month. The nonfarm payroll job data is generally more reliable than the household employment data.
Figure 6: Tucson MSA Total Nonfarm Payroll Jobs and Employed Residents, Seasonally Adjusted, Thousands
Figure 7 shows seasonally-adjusted unemployment rates for Tucson, Arizona, and the U.S. These data also originate from the monthly survey of households. As of April 2022, Tucson’s unemployment rate was 2.9%, which was below the state rate (3.2%) and below the nation at 3.6%.
Keep in mind that the unemployment rate is the ratio of the number of unemployed residents divided by the labor force, which includes employed and unemployed residents. The unemployment rate can fall because unemployed residents find jobs and/or because unemployed residents are dropping out of the labor force. Overall, Tucson’s unemployment rate has dropped primarily because unemployed residents have become employed.
Figure 7: Tucson MSA, Arizona, and U.S. Unemployment Rates, Seasonally Adjusted, Percent
Another measure of labor market performance is the employment-to-population ratio. Unfortunately, we do not have monthly data for Tucson but there are monthly estimates for Arizona and the U.S. The data are calculated by dividing household employment by the non-institutionalized population age 16 and over. Note from Figure 8 that the state employment-population ratio tends to be well below the national average. In part, this reflects Arizona’s demographics, with a higher than average share of the population under age 20 and age 65 and older.
As of April 2022, the employment-to-population ratio had nearly recovered to pre-pandemic levels for both the state and the nation. Arizona’s employment-to-population ratio was 58.9% in February 2020. In April 2022, the ratio was 58.8%. That was nearly back to its February 2020 level but still below the national average of 60.0%. Overall, this indicator also suggests a relatively tight labor market in Arizona.
Figure 8: Arizona and U.S. Employment-to-Population Ratio, Seasonally Adjusted, Percent
The data on labor force participation tell a different story, as Figure 9 shows. Like the nation, Arizona’s labor force participation rate remained well below its pre-pandemic level in April 2022. Prior to the pandemic (February 2020) Arizona’s labor force participation rate was 62.0%. In April 2022, Arizona’s rate was 60.8%, 1.2 percentage points below February 2020 and 1.4 percentage points below the nation (at 62.2%).
In contrast to the nation, Arizona’s labor force participation rate has weakened recently. The labor force participation rate is the ratio of the labor force (employed and unemployed residents) divided by the non-institutionalized population age 16 and older.
Figure 9: Arizona and U.S. Labor Force Participation Rate, Seasonally Adjusted, Percent
Arizona’s labor force participation rate has weakened recently because state labor force growth has slowed markedly, after rapid gains earlier in the pandemic (Figure 10). Individuals may leave the labor force for a variety of reasons: they wish to retire, they need to care for family or have become ill themselves, or they have stopped seeking employment altogether.
Figure 10: Arizona Civilian Labor Force, Seasonally Adjusted, Thousands
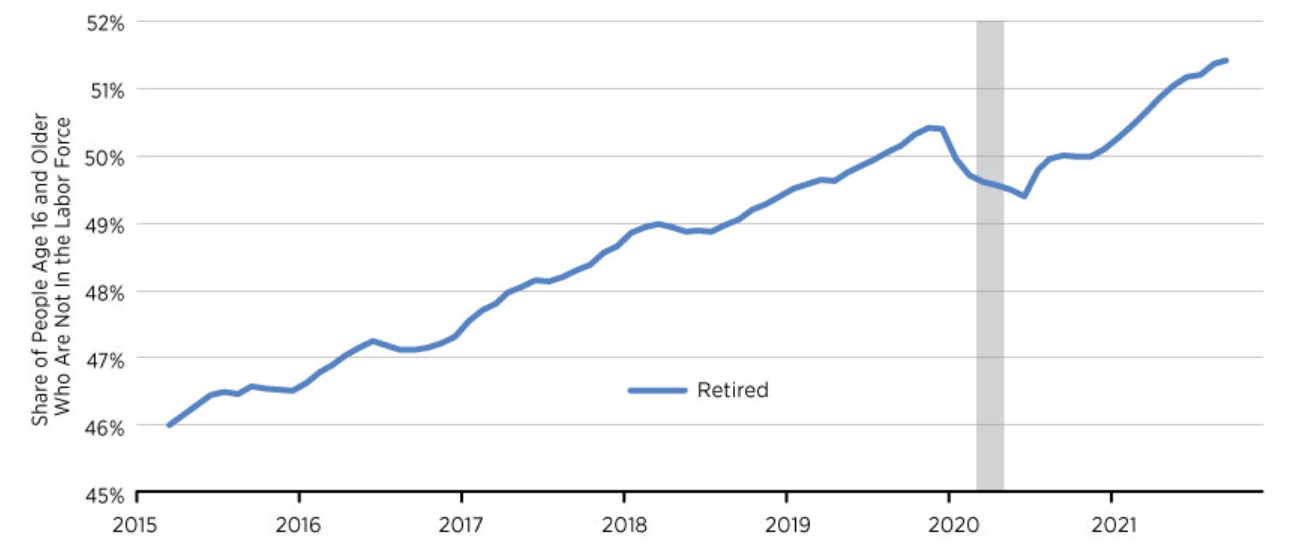
Data at the national level from the St. Louis Federal Reserve Bank suggests that retirements have risen significantly during the pandemic. Figure 11 shows the share of the population age 16 and older who are not in the labor force because they are retired.
Figure 11: Share of the Population Age 16 and Older Not in the Labor Force Due to Retirement
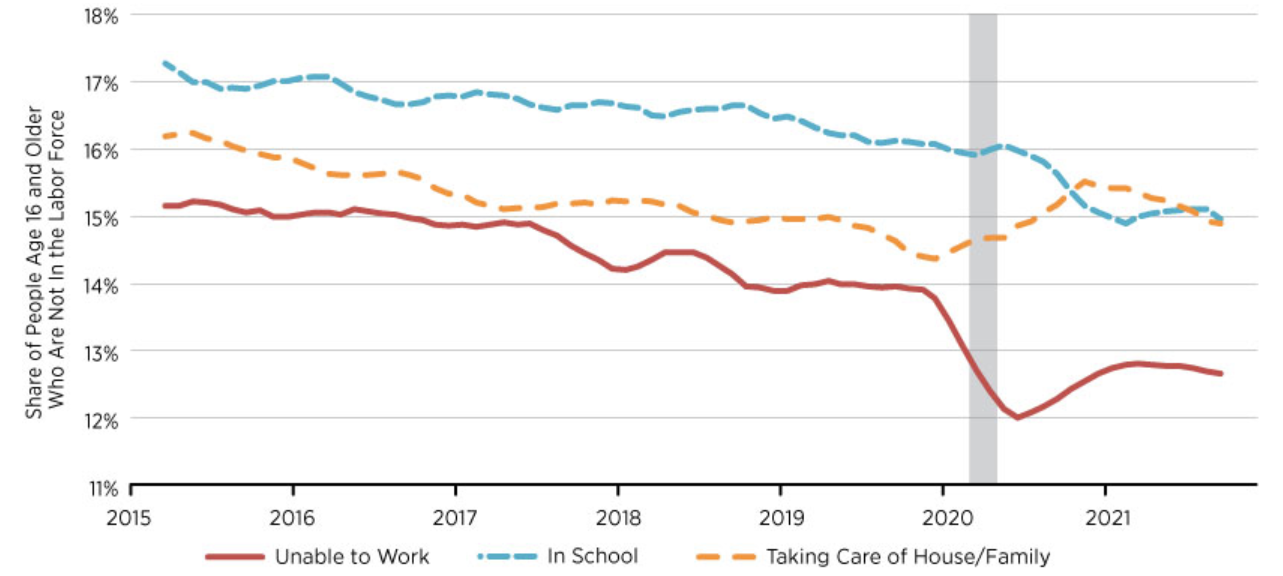
Another factor driving down labor force participation is the increased share of individuals taking care of the home and family during the pandemic. Figure 12 shows the share of the population age 16 and older who are not in the labor force because they are unable to work (perhaps for health reasons), in school, or taking care of the home and family.
Figure 12: Share of the Population Age 16 and Older Not in the Labor Force by Cause
Labor Market Flows Suggest Turmoil
According to data from the U.S. Bureau of Labor Statistics, there were 247,000 open jobs in Arizona in March 2022 (Figure 13). That was up 89,000 from February 2020 and represents approximately 7.5% of total nonfarm jobs. That was just above the U.S. rate of 7.3%.
Nationally, there were 5 unemployed residents for every 10 open jobs in March 2022. That was down from 8 unemployed residents for every 10 open jobs in February 2020. The BLS does not publish these estimates for Arizona, so we cannot benchmark that indicator, but it seems likely that the Arizona labor market was similarly tight.
Figure 13: Arizona Job Openings, Seasonally Adjusted, Thousands
U.S. labor markets are very dynamic. Each month, large numbers of residents are leaving jobs while many others are being hired. During the pandemic, the U.S. and Arizona quit rate has surged. The quit rate is defined as the number of quits divided by total nonfarm jobs. Keep in mind when evaluating these data that the quit rate excludes individuals quitting to retire and those that are being laid off. As Figure 14 shows, Arizona’s quit rate is normally above the U.S. The figure also shows the significant surge in the quit rate in recent months. In March of 2022, 137,000 people quit their jobs in Arizona.
Figure 14: Arizona and U.S. Quit Rates, Twelve-Month Moving Average, Seasonally Adjusted, Percent
In addition to an elevated quit rate, we are also experiencing strong hiring performance. Figure 15 shows the hire rate for Arizona and the U.S. Note that the state hire rate tends to be above the national rate. While the state has seen a significant increase in the hire rate during the pandemic, this is primarily a return to the pre-pandemic normal, in contrast to the unusual surge for the nation. In March 2022, 155,000 people were hired in Arizona.
Figure 15: Arizona and U.S. Hire Rates, Twelve-Month Moving Average, Seasonally Adjusted, Percent
Overall, the data on labor market flows suggests that the state labor market is experiencing increased cross currents. Elevated numbers of workers are quitting while the hire rate has returned to its pre-pandemic level. This fits with anecdotal evidence that workers are quitting jobs in order to search for a better match with their skills and preferences. The pandemic has rendered some jobs less desirable, particularly relatively low-paid, high-personal contact jobs in travel and tourism. It appears that workers in these less-desirable jobs may be quitting to search for higher pay and/or jobs in other sectors, or deciding to retire. These decisions have been caused in large part by the pandemic and have been made feasible by the large increase in federal income support combined with increased personal savings generated by the drop in spending on travel and tourism and increased net wealth driven by solid stock market performance and rising house prices.
The Pandemic Shock Turbo Charged Automation
The pandemic has spurred an increase in automation. While there is little high-frequency data on automation, quarterly U.S. e-commerce retail sales give an indication (Figure 16).
Figure 16: U.S. E-Commerce Retail Sales, Seasonally-Adjusted, Millions of Dollars
The pandemic caused a huge surge of e-commerce retail sales in the second quarter of 2020, with an increase of $51.2 billion dollars. That translated into an over-the-year percent change of 52.7%. E-commerce sales have remained elevated in the ensuing quarters.
This shift to increased online sales has boosted investment in transportation and warehousing, with strong net job growth in that sector. However, this sector has already experienced significant automation and these trends are unlikely to abate.
Increased automation will impact the Tucson MSA labor market. According to a 2019 study released by the Economic and Business Research Center, 154,000 local jobs are at high risk of automation in coming decades. That translated into 42.4% of all local jobs. As Figure 17 shows, Tucson had a lower share of jobs at high risk of automation than did the nation (at 45.7%).
Figure 17: Tucson MSA and U.S. Employment Shares in 2017 by Probability of Computerization
Tucson’s share of jobs at risk of automation was below the national average because manufacturing in Tucson is research oriented. That was driven by the presence of Raytheon and other research-oriented manufacturers.
Figure 18 shows the probability of computerization by NAICS Industry in 2017 for the Tucson MSA and the U.S. Note that the probability of computerization in Tucson manufacturing (0.51) was well below the U.S. at 0.64.
The top three sectors in automation risk in Tucson were leisure and hospitality; trade, transportation, and utilities; and natural resources and mining. The three sectors least exposed to automation risk were education and health services; information; and government. Overall, industries and occupations that will face lower risks from automation are those that require advanced IT skills and programming, basic digital skills, entrepreneurship and initiative taking, leadership and managing others, creativity, and complex information processing and interpretation.
Figure 18: Probability of Computerization by NAICS Industry in 2017 for the Tucson MSA and the U.S.


