 Explore Business Growth in Tucson, Arizona MSA
How are we doing?
Establishment Growth Rate (2024)
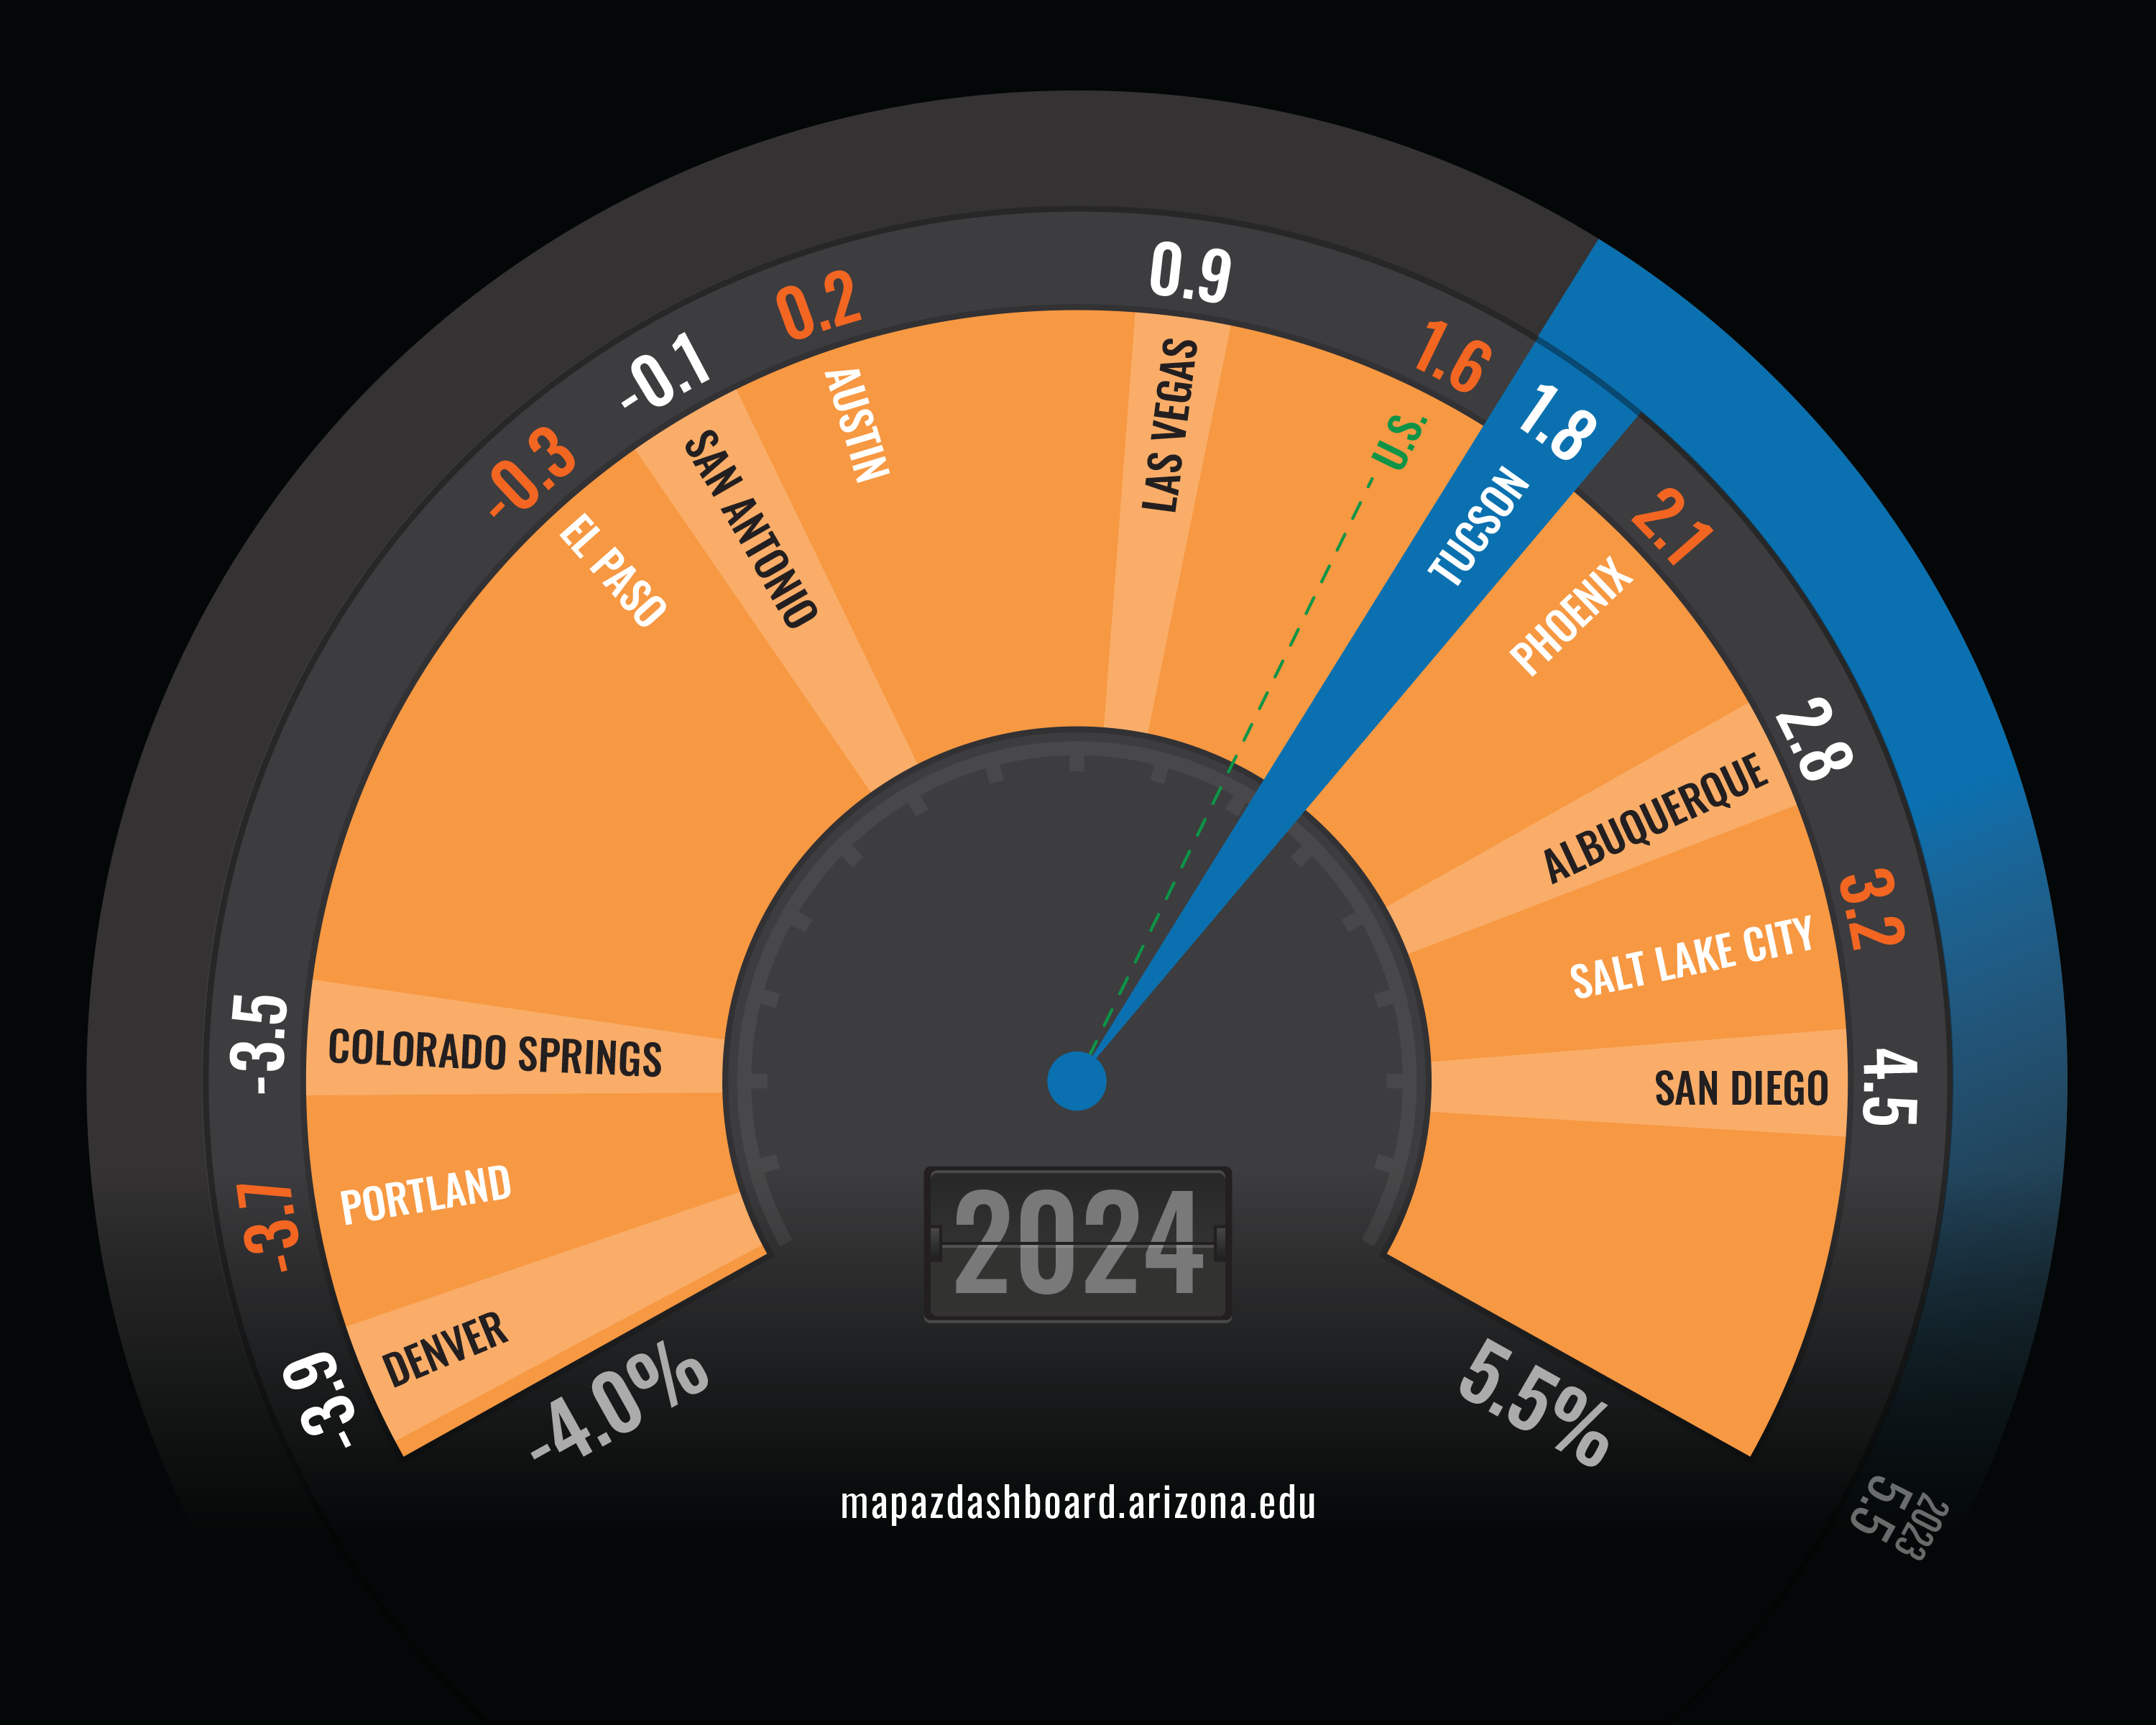
In 2024, the growth in the number of establishments employing workers was 1.8% for the Tucson Metropolitan Statistical Area (MSA). That ranked Tucson fifth among peer western MSAs, unchanged from the previous year. This marks a slowdown from 2023, when growth was 5.5%, and a more pronounced decline compared to 2022 (8.4%) and 2021 (5.8%). The slowdown in growth was consistent with trends seen among peer MSAs and nationally. Several of Tucson’s peer MSAs experienced a decline in the number of establishments employing workers in 2024, with Denver, Portland, and Colorado Springs posting losses between 3.5-3.9%. Tucson’s slow or non-existent growth in business establishments between 2012 and 2020 was a considerable improvement over the substantial decline during the Great Recession. Since then, business growth, or the growth rate in total establishments, has fluctuated annually but experienced an overall upward trend.
Why is it important?
The change in the total number of establishments reflects the dynamism of the local economy and the overall ups and downs of business cycles. Local areas with strong business growth may generate correspondingly strong gains in jobs and income, contributing to higher standards of living and a larger tax base.
How do we compare?
According to the latest data on business starts, the leisure and hospitality sector generated the most new businesses in the Tucson MSA (27.8% of the total), followed by education and health services (23.5%), trade, transportation, and utilities (12.4%), and professional and business services (9.6%). The construction sector accounted for 7.3% of new business starts in 2023, and financial services for 6.9%. The natural resources and mining industry contributed a modest share of new business starts at 0.4% in 2023. Slow gains in natural resources and mining reflect, in part, the capital-intensive nature of these sectors, which makes industry entry and exit relatively expensive.
What are the key trends?
In 2024, Tucson’s total number of establishments employing workers increased by 1.8%, compared to 2.2% in Arizona and 1.6% nationally. Growth was stronger in 2023, when Tucson posted a 5.5% increase, and Arizona and the U.S. grew by 7.1% and 3.0%, respectively. In 2022, business growth in the Tucson MSA exceeded the pre-recession levels seen in 2007 for the first time in sixteen years, with robust growth rates of 8.4% in Tucson, 11.9% in Arizona, and 5.6% nationwide. Since the Great Recession, Tucson and Arizona have experienced an overall upward trend in establishment growth, with particularly strong gains in 2021 and 2022, followed by a slowdown in 2023 and 2024. To explore business starts, closures, expansions, and contractions for the U.S., western states, Arizona counties, and comparison MSAs, visit the Comparison Page.
How is it measured?
Business growth reflects changes in the number of establishments. An establishment is a single physical location at which business is conducted or services or industrial operations are performed. It is not necessarily identical to a company or enterprise, which may consist of one or more establishments. When two or more activities are carried on at a single location under a single ownership, all activities are generally grouped together as a single establishment. The entire establishment is classified on the basis of its major activity, and all data are included in that classification.
Estimates for the number of establishments come from the Quarterly Census of Employment and Wages (QCEW), a quarterly dataset maintained by the Bureau of Labor Statistics (BLS). QCEW data are obtained primarily from state unemployment insurance programs. The QCEW captures approximately 97% of all wage and salary civilian employment in the county. The data exclude those not covered by unemployment insurance: self-employed workers, most agricultural workers on small farms, all members of the Armed Forces, elected officials in most states, most employees of railroads, some domestic workers, most student workers at schools, and employees of certain small nonprofit organizations (BLS, Quarterly Census of Employment and Wages Frequently Asked Questions).
Estimates of business starts, expansions, contractions, and closures come from Business Dynamics Statistics (BDS), an annual dataset maintained by the U.S. Census Bureau and extracted from the Business Register. This dataset cover businesses that generate most of the country's economic activity. The data exclude non-employer businesses, private households, railroads, agricultural production, and most government entities.


