 Women Mean Business: Data on Female-Owned Businesses in Tucson, Arizona MSA
In the U.S., more than a third of businesses were owned by women in 2018. Most of those businesses were nonemployer firms, such as sole proprietorships. That is noteworthy as most firms in the nation do not have paid employees. In fact, in 2018, over 82% of businesses in the nation were nonemployer. Of nonemployer firms in the U.S., 41.0% were female-owned compared to 19.9% of employer firms (those with a payroll). In Arizona, 41.9% of nonemployer firms were owned by women, while only 19.8% of employer firms were women-owned. The percent of female-owned nonemployer firms was even higher in Tucson at 44.6%, while 21.6% of employer firms were female-owned. The most recent data that combines employer and nonemployer statistics is 2018.
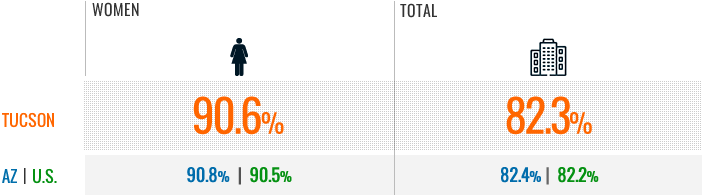
Most businesses in the nation are nonemployer (82.2%), and an even higher percentage of female-owned businesses are nonemployer (90.5%). That is also true for Arizona, where 82.4% of all businesses and 90.8% of female-owned businesses were nonemployer firms in 2018. Tucson MSA figures are similar to the U.S. and Arizona with 82.3% of all businesses being nonemployer and 90.6% of female-owned businesses not having employees (Figure 1). This article focuses primarily on nonemployer businesses for that reason.
Figure 1: Percent nonemployer businesses (2018)
The western states tracked on the MAP have a high percentage of female-owned businesses compared to the nation. In 2018, all the states tracked, except Idaho and Utah, had a higher percentage of female-owned businesses than the U.S. New Mexico had the largest share of female-owned businesses and was among the top five nationally. Arizona ranked fourth out of all MAP states and 16th in the U.S. Utah had the lowest percentage of female-owned businesses in the West and ranked low nationally. By virtue of population size, California and Texas had the largest total number of female-owned businesses out of the MAP states, followed by Colorado, Washington, and Arizona. Figure 2 displays the percent of female-owned nonemployer businesses by state.
Figure 2: Percent of female-owned businesses by state
Tucson had the largest share of female-owned businesses among peer metro areas at 44.6% followed by Albuquerque at 44.5%. When considering employer owned businesses for females, Colorado Springs had the highest share at 23.9%. Salt Lake City had the smallest share of female-owned businesses, for both employer and nonemployer firms. Figure 3 shows the percent of female-owned nonemployer businesses ranked by metropolitan area.
Figure 3: Percent of women-owned nonemployer businesses
Industry
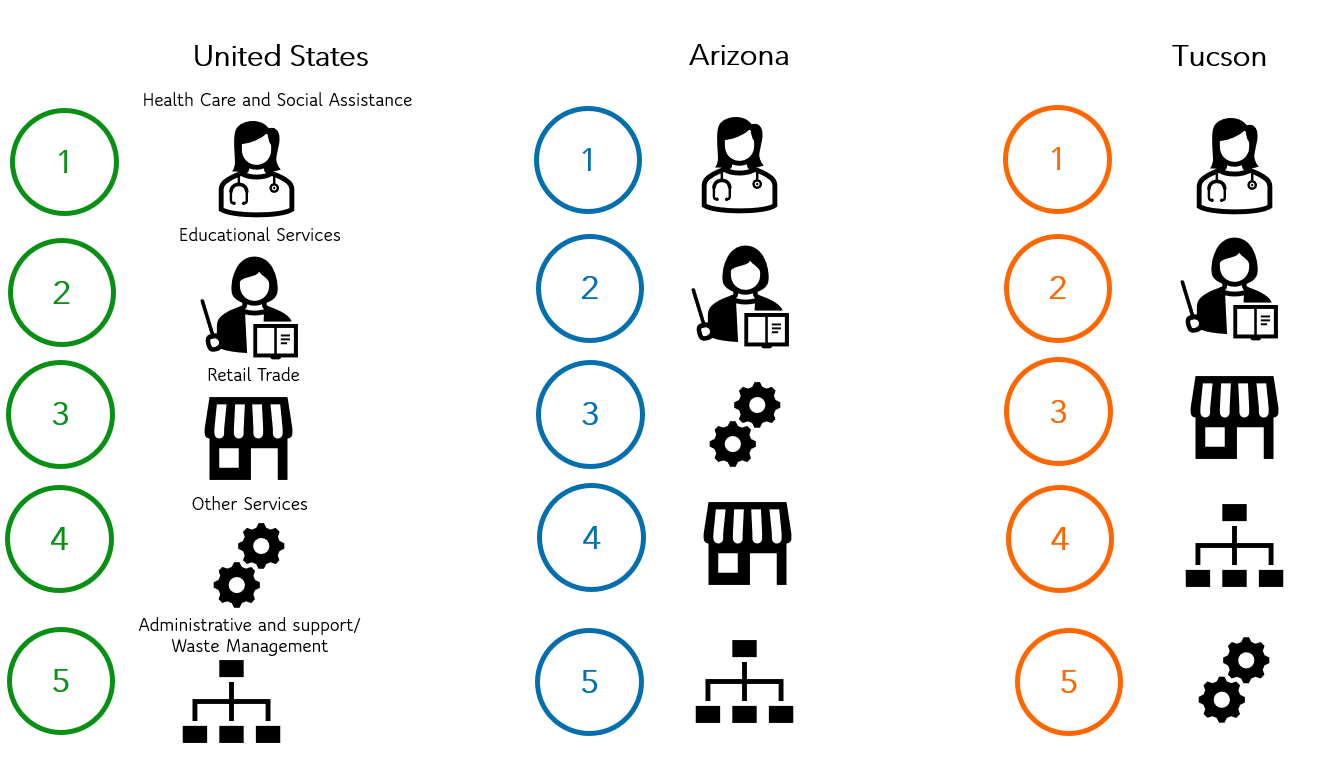
The industry most represented among women-owned businesses was health care and social assistance, which had the largest percentage of female-owned businesses for the U.S., Arizona, and the Tucson MSA. The top five industries for female-owned businesses are the same for the U.S., Arizona, and Tucson with only the rankings changing somewhat between them (Figure 4). They are health care and social assistance, educational services, retail trade, other services, and administrative and support and waste management.
Other services includes such things as personal care services (like beauty and nail salons), funeral homes, dry cleaning and laundry services, as well as grantmaking and social advocacy organizations. Administrative and support and waste management includes employment services, business support services (like call centers and document preparation services), travel agencies, janitorial services, convention and trade show organizers, and waste collection.
Figure 4: Industries with largest share of female-owned nonemployer firms
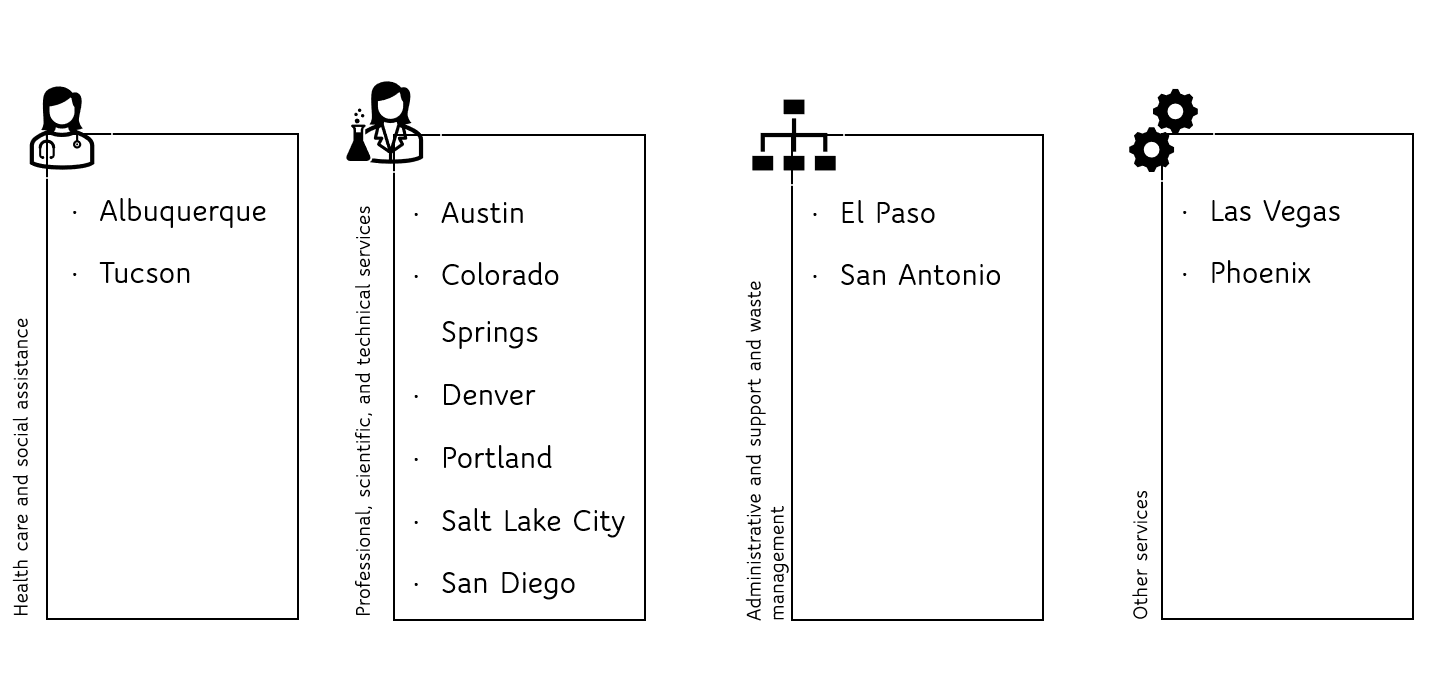
The highest number of female-owned nonemployer businesses for each MSA tracked on the MAP Dashboard are listed in Figure 5. They match closely with the top industries for women-owned businesses in the nation with one addition: professional, scientific, and technical services (which ranked seventh nationally for nonemployer firms). Professional, scientific, and technical services includes such businesses as legal services (lawyers, notaries, title agencies), accounting and bookkeeping services, architectural and engineering services, interior design, graphic design, human resources, computer systems and programming, advertising agencies, marketing, translation services, and scientific research.
The least likely sectors to be owned by women were utilities and mining. Both were either at the bottom of the list or suppressed for all metropolitan areas represented.
Figure 5: Largest number of female-owned nonemployer businesses by MAP metro
Revenues
Average sales, value of shipments, or revenue per firm were generally lower for female-owned businesses compared to all businesses in 2018. Nationally, revenue per firm for all nonemployer businesses (total sales, value of shipments, or revenue divided by the number of firms) was $48,806 in 2018. Women-owned nonemployer businesses came in at $27,595, considerably less than all businesses. Among MAP metropolitan areas, women-owned businesses in San Diego had the highest sales revenue at $31,856, while El Paso was at the bottom with $23,055 (Figure 6). Tucson was near the bottom of the spectrum at $24,949, with only Colorado Springs and El Paso lower. However, Tucson had the smallest difference compared to revenue for all firms (at $15,454), meaning female-owned businesses in Tucson came the closest to earning the same as all firms for the metropolitan areas tracked on the MAP. The gap between women-owned businesses and total businesses for sales, value of shipments, or revenue per firm was largest in El Paso at $26,081.
Figure 6: Sales, value of shipments, or revenue per nonemployer firm ($)
Business ownership is defined as having 51% or more of the stock or equity in the business. To be considered female-owned, a woman (or women) must own 51% of the business. Nonemployer businesses are those with no paid employees or payroll and have annual receipts of $1,000 or more (except for construction industries). Most nonemployer businesses are sole proprietorships – this holds true for both total and female-owned businesses in the U.S. and Arizona. There are other nonemployer businesses, such as partnerships, S-corps and C-corps. Business owners report company revenue as personal income for S-corps.
These data come from the U.S. Census Bureau Annual Business Survey program (ABS), which provides demographic information on business ownership, both for employer businesses (collected by survey) and nonemployer data (compiled from administrative records). Beginning in 2018, the Census Bureau made available statistics that combine Annual Business Survey (employer) with nonemployer statistics. The NES-D is an annual statistical series that uses existing administrative records (AR) and census data to link demographic characteristics to the universe of nonemployer businesses. The Census Bureau provides annual business owner demographics for all businesses through a blended-data approach that combines AR-derived estimates for nonemployer businesses from NES-D and survey-derived estimates for employer businesses from the Annual Business Survey (ABS). The ABS is sponsored by the National Center for Science and Engineering Statistics within the National Science Foundation.


