 The Acceleration of the Housing Market in Tucson, Arizona MSA
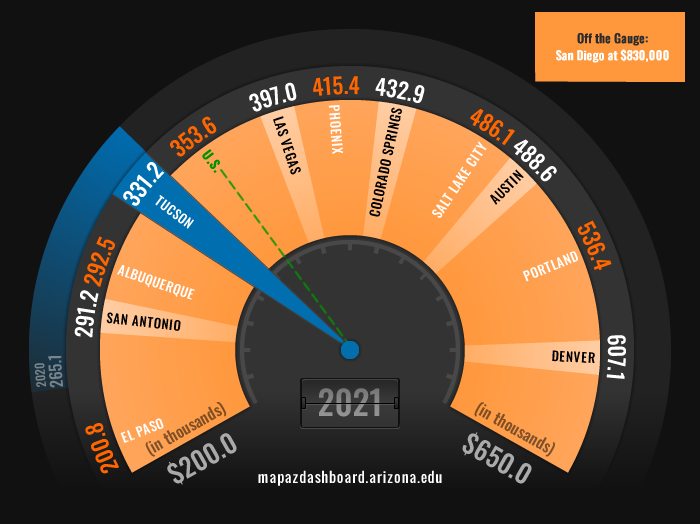
Tucson’s single-family home prices went into overdrive in 2021, increasing by 24.9% to $331,200. Despite the rapid growth in 2021, Tucson has a relatively low median home price when compared to its peers. Only three MSAs measured on the MAP reported lower single-family median home prices in 2021. El Paso posted the lowest median home price at $200,800, followed by San Antonio and Albuquerque. San Diego’s median home price in 2021 was so much higher than the other 12 MSAs tracked on the MAP that it was off the gauge at $830,000 (Figure 1). That was more than $200,000 higher than the next highest MSA, Denver, at $607,100. Home prices have steadily increased in Tucson since the Great Recession with a significant acceleration in prices over the past two years.
Figure 1: Median Home Price (2021)
Tucson’s home prices have increased at a rapid pace over the past few years. However, it still remains one of the most affordable places to buy a home when compared to peer MSAs. In 2021, 64.4% of homes sold in Tucson were considered affordable for a family earning the local median income. That ranked Tucson second among peers, behind Albuquerque. Nationally 57.3% of homes in the U.S. were affordable. The median home price in many MSAs across the West is rising at a fast pace. However, wages are also rising, thus allowing some regions to remain affordable for those earning at least the median family income.
While Tucson’s housing remains relatively affordable when compared to peers, the percent of affordable homes has declined significantly since 2020. (Figure 2). In the first quarter of 2022, housing affordability in Tucson rebounded a little from the fourth quarter of 2021 to 66.0%, but was still a decline of more than nine percentage points from the first quarter of 2020. Housing affordability has declined in all MSAs tracked on the MAP Dashboard. Tucson’s decline of 9.1 percentage points between the first quarter of 2020 and the first quarter of 2022 was relatively modest compared to the more than 20 percentage point declines in Phoenix, Las Vegas, and Salt Lake City.
Figure 2: Housing Affordability Quarterly
Tucson may still be affordable to someone earning the local median household income but that is not the case for everyone. Those in the lower-income brackets and renters often struggle to find affordable housing. The MAP Dashboard’s housing cost burden indicator reports that more than 50% of renters and 40% of those earning less than $20,000 pay more than 30% of their income on housing or rental-related costs.
Data reported by Apartment List indicates that rent prices on one-and-two-bedroom apartments in the Tucson MSA increased by 16.8% between 2020 and 2021. That translated to an average rent price of $1,141 in 2021 (Figure 3). While Tucson’s overall price level is relatively low compared to peers, rent prices in Tucson increased at one of the fastest rates when compared to the MSAs tracked on the MAP Dashboard. Phoenix posted the fastest growth in rent prices at 19.1%, while Portland posted the slowest growth at 7.2%.
Figure 3: Average Rent Price for One-and-Two Bedroom Apartments
The purchase price of a single-family home in the Tucson MSA increased by 24.9% in 2021 (Figure 4). That follows an increase of 11.0% in 2020. In 2020, the price of a single-family home in the Tucson MSA reached and exceeded the previous high of $244,900 that occurred just before the Great Recession. Tucson’s home prices then skyrocketed to $331,200 in 2021. Among MSAs tracked on the MAP Dashboard, Austin posted the fastest growth in home prices in 2021 at 33.1%, while El Paso the slowest at 12.9%.
Figure 4: Growth Rate in the Price of a Single-Family Home
Overall, the Tucson housing market has been rocked over the past few years by skyrocketing prices, declining affordability, historically low supply, and high demand. Will these trends continue? There is emerging evidence that this trend could be cooling down. Recent data on home sales indicates that homes are staying on the market longer, and supply has increased slightly. Declining affordability, driven by high prices and rising interest rates, is contributing to slowing activity. In addition, while housing inventory has stabilized at historically low levels, there has been a modest upward movement in recent months (Figure 5).
Figure 5: Available Housing Supply For Sale in Tucson
The MAP will continue to report updated data on home prices, affordability, and rent prices as data become available. Upcoming quarterly data on home prices and affordability will help to determine if the Tucson market is beginning to level off and stabilize to a more historic growth pattern. Stay tuned for a detailed article on the trend in rent prices.


