Benchmarking economic performance across metropolitan areas requires us to think about activities across many different dimensions. Certainly, overall job, population, and income growth matters, but growth rates alone do not tell us much about prosperity. On that dimension, economists generally resort to measures like per capita income, per worker Gross Domestic Product (an indicator of productivity), and per worker wages. However, these standard measures of prosperity also have limitations. In particular, they do not tell us anything about how equally income is shared across a metropolitan area’s residents. To address this dimension of economic performance, we need indicators of inclusion. Luckily, the Brookings Institution recently constructed rankings of economic inclusion for the 100 largest metropolitan areas in the U.S.
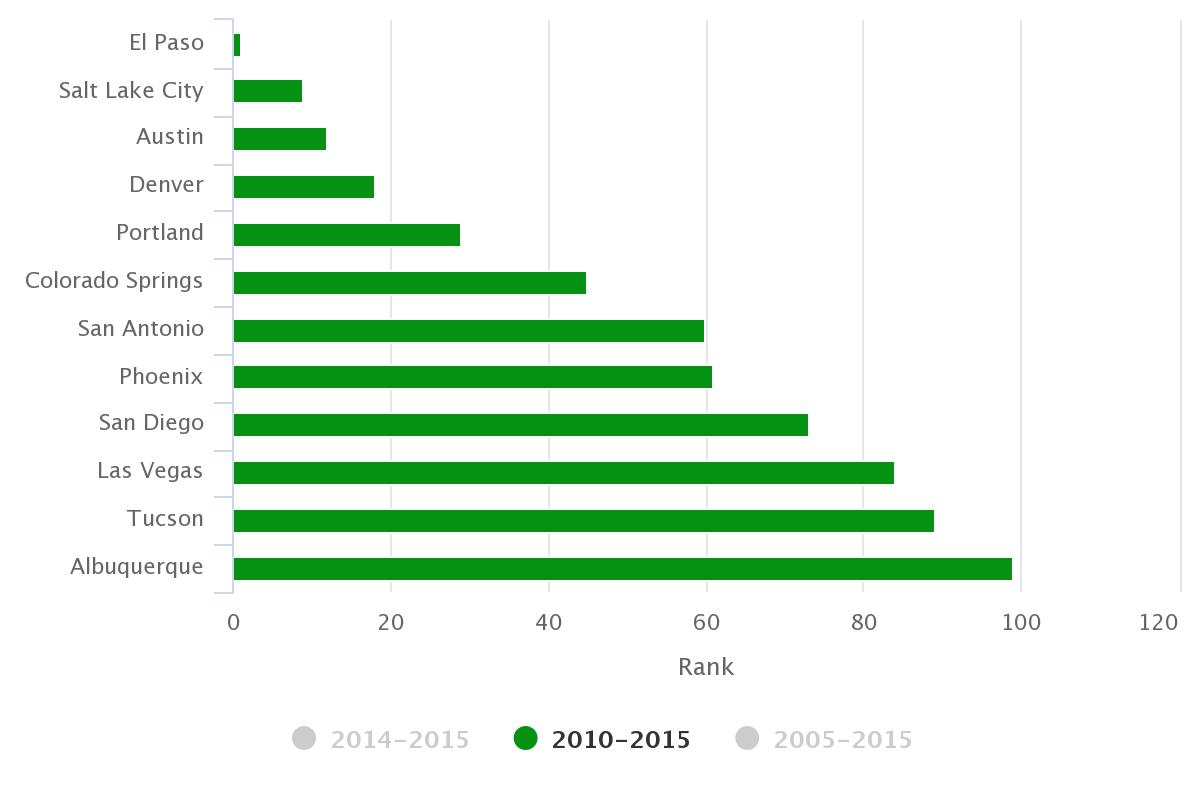
How does Tucson stack up? According to Brookings, Tucson ranked near the bottom relative to the 100 large metropolitan areas tracked. During the 2010-2015 period, Tucson’s inclusion ranking was 89th in the nation. As Figure 1 shows, Tucson also ranked low relative to the other western metropolitan areas tracked on the MAP Dashboard, at 11th, above only Albuquerque during the 2010-2015 period. Note also that Tucson’s rank was fairly consistent across the three time periods.
Figure 1: Brookings Economic Inclusion Rankings For Select Western Metros Among the 100 Largest Metropolitan Areas Between 2010-2015
Note: Shorter Bars Equal Higher Rank
How were the rankings constructed? Brookings maintains a Metro Monitor database, which tracks measures of growth, prosperity, and inclusion. Of particular interest are their measures of inclusion: employment rate, median wage, and relative poverty. The employment rate is measured as the share of all residents age 18-64 who are employed. The median wage is the annual wage earned by the person in the middle of the metropolitan area’s income distribution. Relative poverty is the share of residents earning less than 50% of the local median wage. Thus, a decline in relative poverty is good. Composite rankings (shown above) are constructed from these measures.
The Brookings Institution also released a report that highlights the importance of inclusive growth for the 100 largest metropolitan areas in the U.S. As the authors note, metropolitan areas that have scored well on measures of growth and prosperity have not often done as well on indicators of inclusion. Metropolitan areas that did well on all three dimensions seemed to have a few characteristics in common. They generated job gains in high-skill sectors (like advanced business and professional services, information, and manufacturing) that served national or even global markets. They also added workers in lower-skill jobs within those sectors and experienced growth spillovers to higher-wage industries focused on local growth (construction, logistics, health care). Finally, they generated solid gains in lower-paid sectors (like hospitality and retail). These characteristics combined improve the inclusivity of economic performance. While achieving success across all three dimensions of economic performance is not easy, it is a worthy goal.


