Pavement quality plays a vital role in traffic safety and commuter comfort. When roads wear out, they must be rehabilitated and resurfaced to maintain smooth, safe driving conditions. Deteriorated roads also increase user costs, which over time can amount to a significant financial burden on the traveling public. This article highlights pavement conditions in the Tucson urbanized area, in comparison to other western urbanized areas and the U.S., using the latest data from the Federal Highway Administration. The data show that Tucson’s roads are relatively rough, compared to those in 11 other western urban areas. For instance, In 2013 Tucson ranked eighth among 12 western urban areas in the smoothness of other principal arterial roads, which are particularly important for local drivers. If we account for local driving patterns across all major road types, Tucson ranked 12th in road smoothness.
How are we doing?
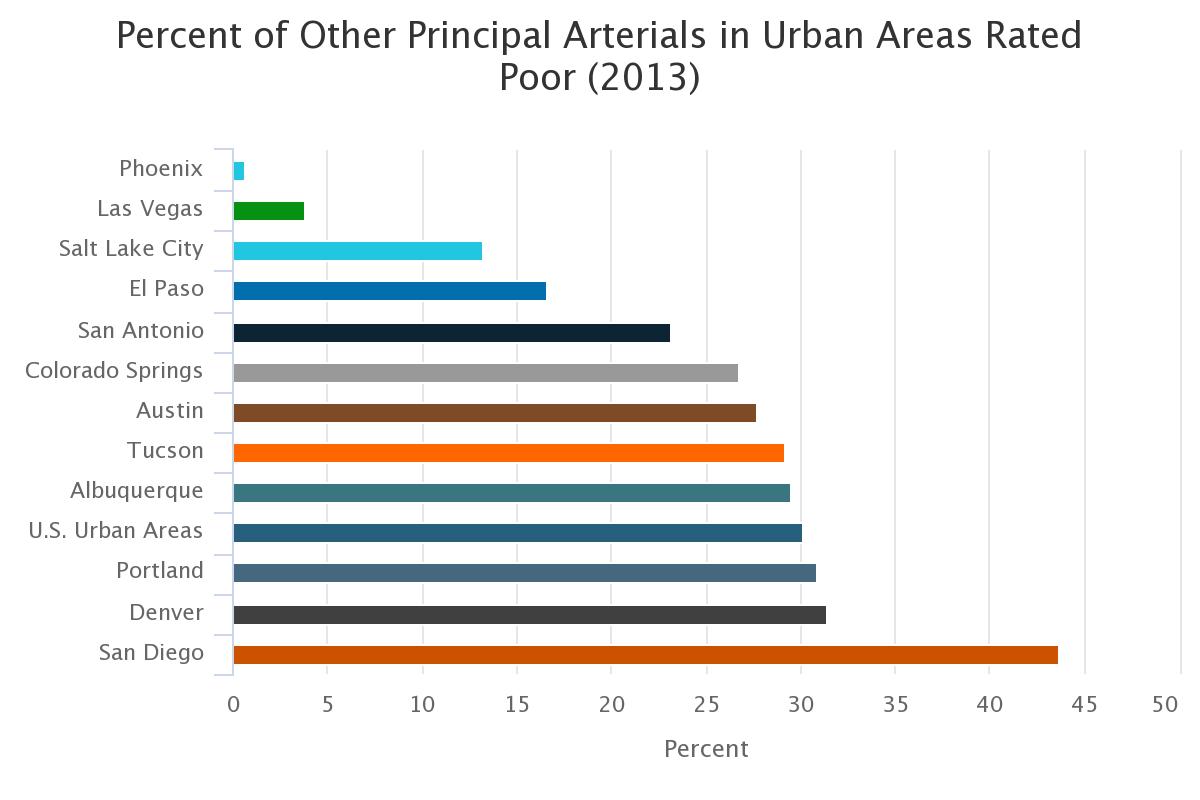
In 2013, 29.2% of other principal arterials in the Tucson urban area were rated as poor and in need of repair. This ranked Tucson eighth among 12 western urban areas, as the figure below shows. Other principal arterials are heavily used urban roads that collect traffic from intersecting residential streets, and direct it toward employment or business centers, or other travel routes such as freeways and interstates. An example for Tucson would be Grant Road. These roads are very important for Tucson, because they account for a relatively large share of vehicle miles traveled. Phoenix placed first in the smoothness of other principal arterial roads, with 0.6% poor, and San Diego was last with 43.7%. Tucson was 0.9 percentage points ahead of U.S. urban areas at 30.1% and behind the Phoenix urban area (0.6%) by 28.6 percentage points.
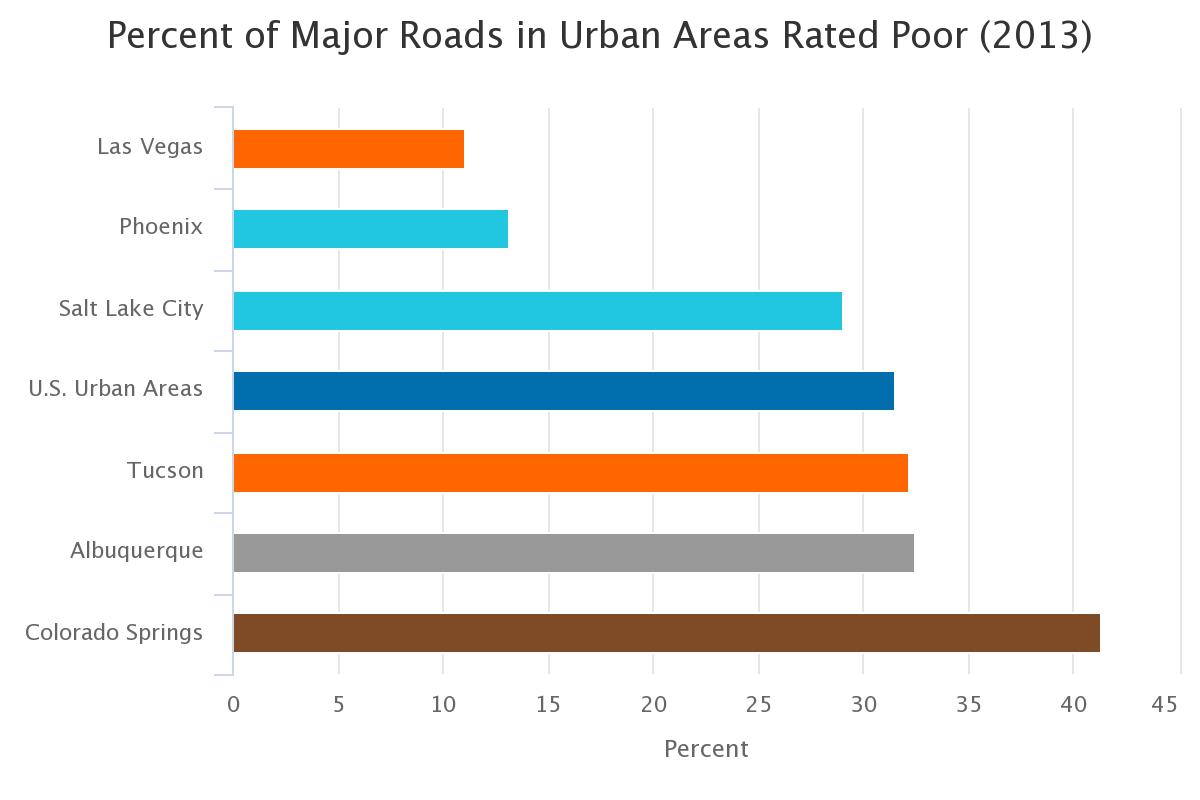
Nearly one third (32.2%) of major roads in the Tucson urbanized area were classified as poor in 2013. Major roads include interstates, other freeways & expressways, other principal arterials, and minor arterials combined. An additional 24.3% were in mediocre condition. 13.2% were fair, and 30.3% were classified as good. When compared among 12 western urban areas, Las Vegas had the smoothest roads, with the lowest percentage classified as poor (11.0%). As the figure below shows, San Diego came in last with 51.0% poor. Tucson was just behind the U.S. at 32.2% poor and significantly behind Phoenix (by 19.1 percentage points).
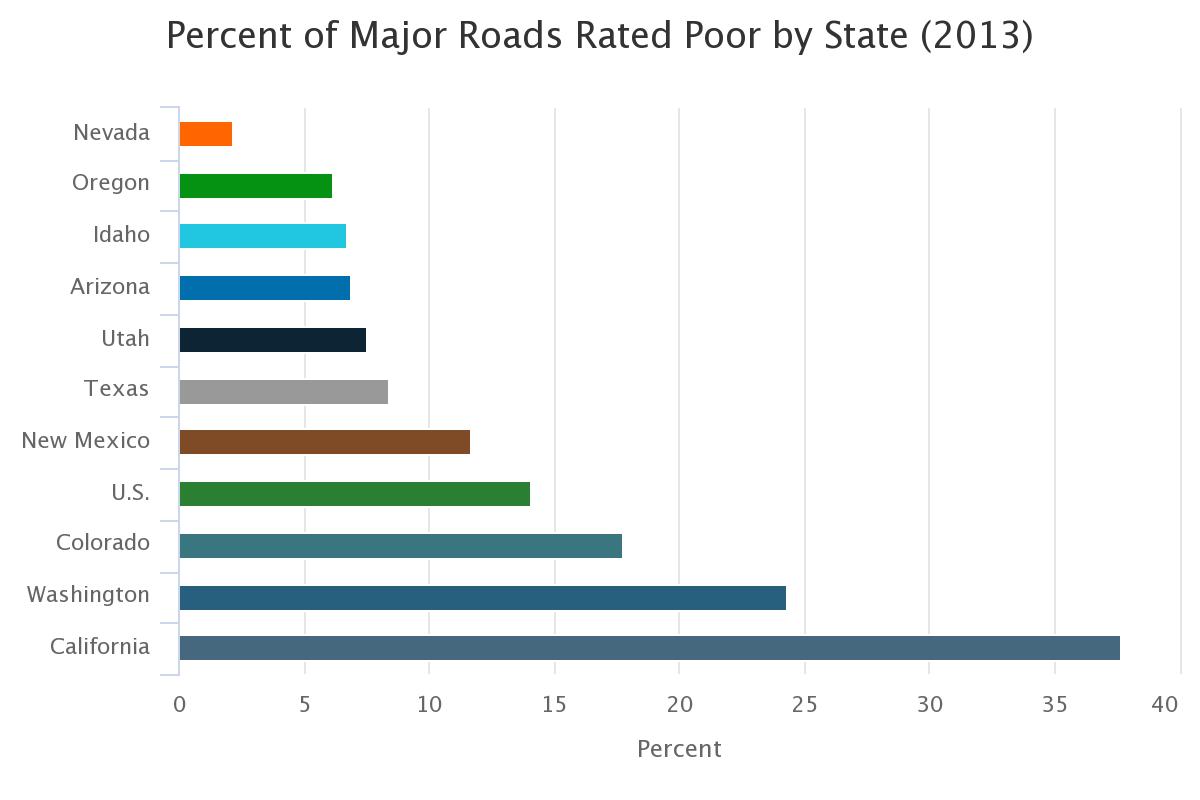
Among 10 western states, Arizona placed fourth, with 6.9% of major road mileage in poor condition. Nevada had the smoothest roads with 2.2% rated as poor, and California had the roughest, with 37.7%. Arizona was 7.2 percentage points ahead of the U.S., and 30.8 percentage points ahead of last place California.
Pavement quality impacts motorists on the roads they use often and on which they travel at higher speeds. For example, interstates and other principal arterials handle heavy traffic volumes, at elevated speeds. They are important to maintain because safety risks and user costs due to roughness increase with speed (Chatti, K., & Zaabar, I. 2012). Travel volume by road type matters, therefore the IRI data are broken down into categories to prioritize which are most in need of repair. Interstates are limited access highways with divided travel lanes. They are designed for long-distance travel, and designated as interstates by the U.S. Department of Transportation. Other freeways and expressways are similar to interstates, but lack designation and may include a limited number of at-grade intersections. Other principal arterials facilitate large traffic volumes, but provide more connectivity to abutting land uses and are less access controlled. Minor arterials serve to connect arterial routes with residential and collector streets (FHWA, 2013).
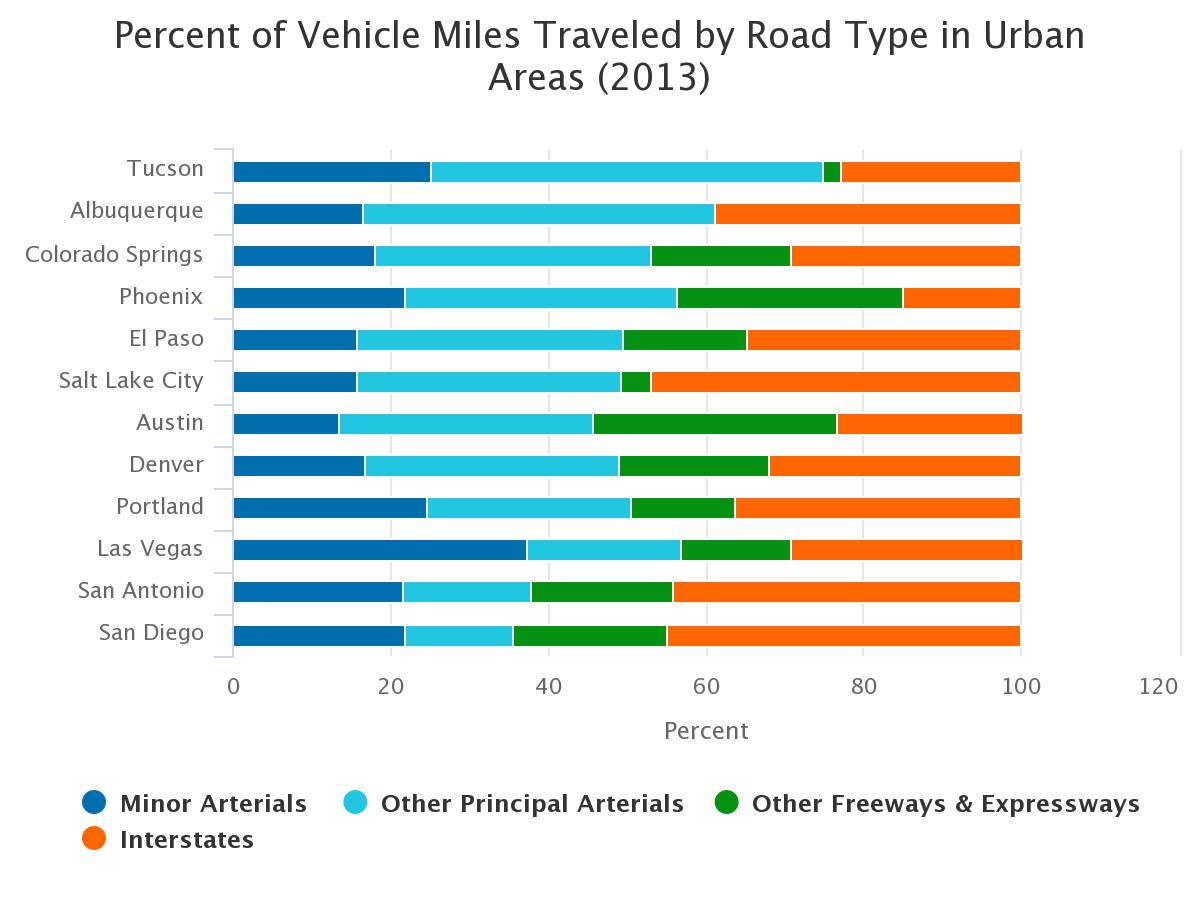
In 2013, 49.7% of vehicle miles traveled (VMT) on major roads in the Tucson urbanized area were on other principal arterials, such as Grant Road, making it the most heavily used road type. This was followed by minor arterials, such as Tucson Boulevard, at 25.2%, interstates such as I-10 at 22.9%, and other freeways & expressways such as Aviation highway at 2.1%
Among 12 western urbanized areas, Tucson had the highest percentage of vehicle miles traveled on other principal arterials, of which 29.2% were rated as poor in 2013. Tucson ranked near the bottom in the percentage of VMT on interstates, which tended to be in far better condition than other principal arterials (0.3% poor in 2013). Salt Lake City (47.0%) and San Diego (45.0%) had the largest share of VMT on interstates. Phoenix had the lowest share traveled on interstates (15.1%), and the second largest share traveled on other freeways & expressways (28.5%).
It is important to keep in mind that the data displayed in the second and third figures (percent of major roads rated poor) do not reflect local driving habits and how they differ across urban areas. For instance, we know from the data on vehicle miles traveled that Tucson residents drive much more on other principal arterials (which are relatively rough) than do residents of other urban areas. Thus, we should account for both differences in road roughness by road type and differences in vehicle miles by road type. We can incorporate these differences by weighting the road pavement quality data using vehicle miles traveled by road type. The figure below shows the ranking of urban areas using a VMT weighted score of the percent of miles rated poor by road type. As the figure makes clear, Tucson ranked 12th out of the 12 urban areas. This reflects the fact that Tucson residents frequently drive on the relatively rough other principal arterials.
![]()
The state rankings change very little when we account for driving differences (again using vehicle miles traveled) across states, because the differences in roughness and driving habits are not as dramatic. Nevada ranked first, with the smoothest roads, and California last. Arizona ranked fifth.
![]()
Why is it important?
Numerous factors influence pavement quality including funding, climate, jurisdictional boundaries, and user characteristics. Most funding for federal-aid highways is distributed to states by the federal government, using formulas based on population levels, historical funding amounts, and each state’s relative contribution to the Highway Trust Fund. The federal government reimburses states and urban areas for about 80% of transportation project expenditures, and the remaining 20% is financed by local governments through taxes, bonds, and private contributions. Local governments have flexibility over which projects are considered for funding, and can improve road quality by advancing more maintenance related projects for consideration.
Proper maintenance lengthens the useful life of a roadway, maximizes traffic safety, and minimizes repair & maintenance costs for road users. One study has estimated that preventative maintenance such as resurfacing can have a 50-fold return on investment, when compared to the additional maintenance costs borne by users of substandard roads (Islam & Buttlar 2012). Other research has found that pavement roughness increases the likelihood of traffic accidents (Chan, et. al. 2010; Bester, S. 2003; Anastasopoulos, et. al. 2012). For example, rough pavement decreases skid resistance, reducing motorist control under adverse driving conditions.
How do we compare?
Pavement quality varies greatly by the type of roadway, as the figure below shows. For example, 29.2% of other principal arterials in the Tucson urban area were ranked as poor in 2013, which was 0.9 percentage points better than U.S. urban areas. In contrast, less than 1% of interstates were in poor condition, 4.8 percentage points ahead of U.S. urban areas at 5.1%. San Diego ranked last in pavement quality for other principal and minor arterials, which combined, bear about 35.5% of traffic volume in San Diego. Las Vegas had the best roads overall and Phoenix had the smoothest other principal arterials, at 0.6% poor.

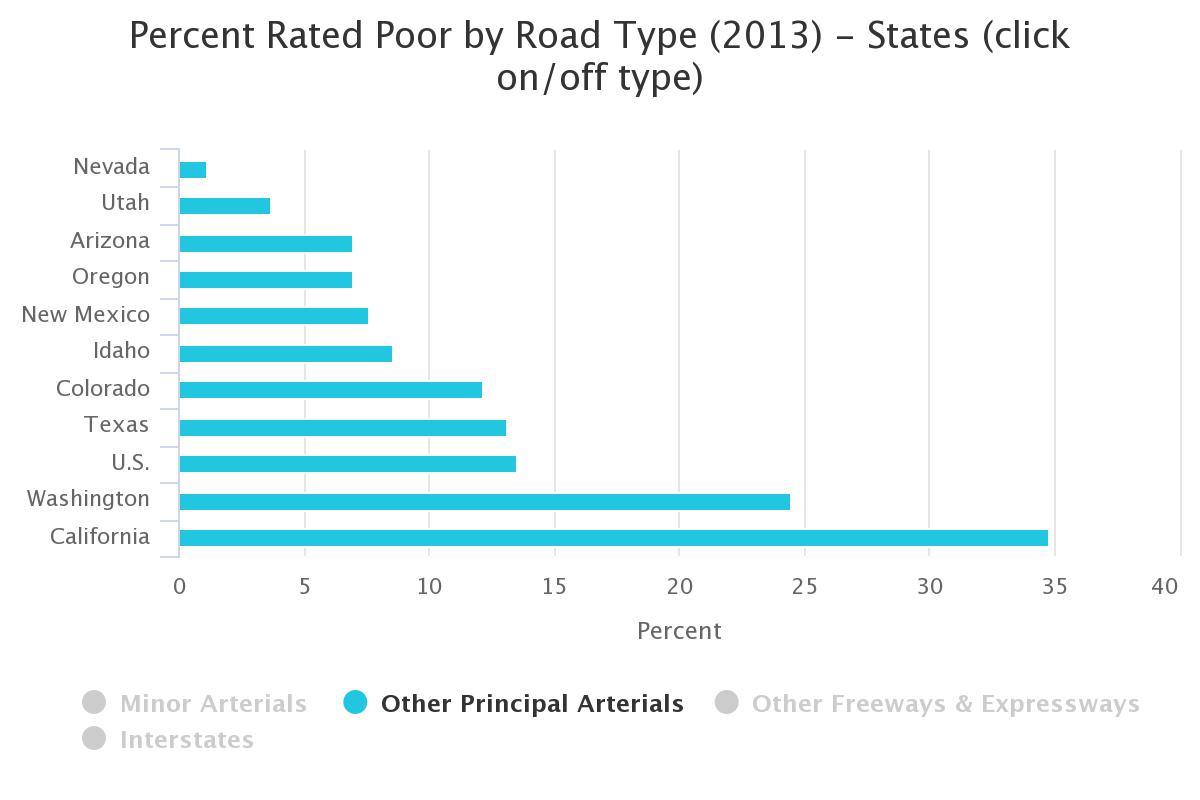
Arizona ranked third among 10 western states in 2013, with 7.0% of other principal arterials rated as poor. This was 6.5 percentage points ahead of the U.S., at 13.5%. Nevada was first with 1.1%, and California was last with 34.8%. California also had the worst interstates, and other freeways & expressways with 10.0% and 10.5% poor, respectively. Utah had the best interstates (0.08%), and California had the worst minor arterials (46.4%).
How is it measured?
Federal Highway Administration (FHWA) data on pavement roughness by state and urbanized area are reported as the International Roughness Index (IRI) in inches per mile. The IRI is computed by dividing accumulated vehicle suspension motion in inches by the distance traveled in miles. Suspension vibration is gauged with a sensor installed in the wheelbase of a standard vehicle. IRI data are reported for the type of road, such as interstate, other freeway & expressway, other principal arterial, and minor arterial. Lower scores indicate smoother pavement. An IRI score of less than 95 is considered good, while roads with ratings 170 or more are considered poor and in need of repair. Scores between 95 and 119 indicate roads in fair condition while scores between 120 and 169 represent roads in mediocre condition.
Federal-aid urbanized areas include, at minimum, a census designated place with an urban population of 5,000 to 49,999, or a census designated urban area with a population 50,000 or more. Boundaries of federal-aid urban areas may be adjusted to reflect urbanization and transportation needs. Accordingly, they may include densely settled urban areas adjacent to the census designated urban area, as approved by the U.S. Department of Transportation. Urban areas differ from metropolitan statistical areas, which are comprised of counties that contain an urban area, as well as adjacent counties that meet certain population density and connectivity requirements.
Endnotes
Anastasopoulos, P. C., Mannering, F. L., Shankar, V. N., & Haddock, J. E. (2012). A study of factors affecting highway accident rates using the random-parameters tobit model. Accident Analysis & Prevention, 45, 628-633. See. p. 631
Bester, C. J. (2003, January). The effect of road roughness on safety. In TRB 2003 annual meeting.
Chan, C. Y., Huang, B., Yan, X., & Richards, S. (2010). Investigating effects of asphalt pavement conditions on traffic accidents in Tennessee based on the pavement management system (PMS). Journal of advanced transportation, 44(3), 150-161. See pp. 157-158
Chatti, K., & Zaabar, I. (2012). Estimating the effects of pavement condition on vehicle operating costs. National Cooperative Highway Research Program (Vol. 720). Transportation Research Board. pp. 37, 49, 50
Federal Highway Administration, United States Department of Transportation (2103) Highway Functional Classification Concepts, Criteria and Procedures http://www.fhwa.dot.gov/planning/processes/statewide/related/highway_functional_classifications/fcauab.pdf
Islam, S., & Buttlar, W. G. (2012). Effect of pavement roughness on user costs. Transportation Research Record: Journal of the Transportation Research Board, 2285(1), 47-55. See p. 53


