The MAP Dashboard recently released its inaugural Annual Report providing a snapshot of the MAP Dashboard as of spring 2018, using the most up to date data available. The report summarizes the latest results for all indicators and highlights key changes during the past year. It also documents changes to the website during 2017, brings together website metrics, and summarizes outreach activities.
Examples of key conclusions found in the Annual Report include:
- Job growth in the Tucson Metropolitan Statistical Area (MSA) accelerated to 1.5% last year, up slightly from 1.3% in 2016. While local growth was close to the national average last year, it still ranked low among peer metropolitan areas.
- The Tucson MSA ranked first among peer Western metropolitan areas in housing affordability, which has gradually declined as house prices rose faster than income.
- Tucson MSA residents reported worse mental health than most peer metropolitan areas. However, the local area did better in terms of physical health.
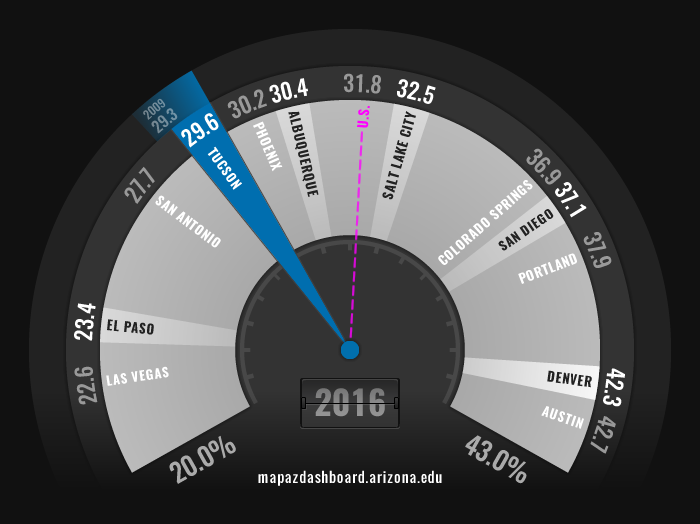
- In 2016, Tucson MSA ranked ninth among peer metropolitan areas in the percent of the working age population that had a bachelor’s degree of better (Figure 1). This was well below Austin, at 42.7%, but well above Las Vegas, at 22.6%.
Figure 1: Four-Year College Attainment for the Working Age Population (2016)