 Measuring Progress and Inspiring Action in Workforce & Demographics
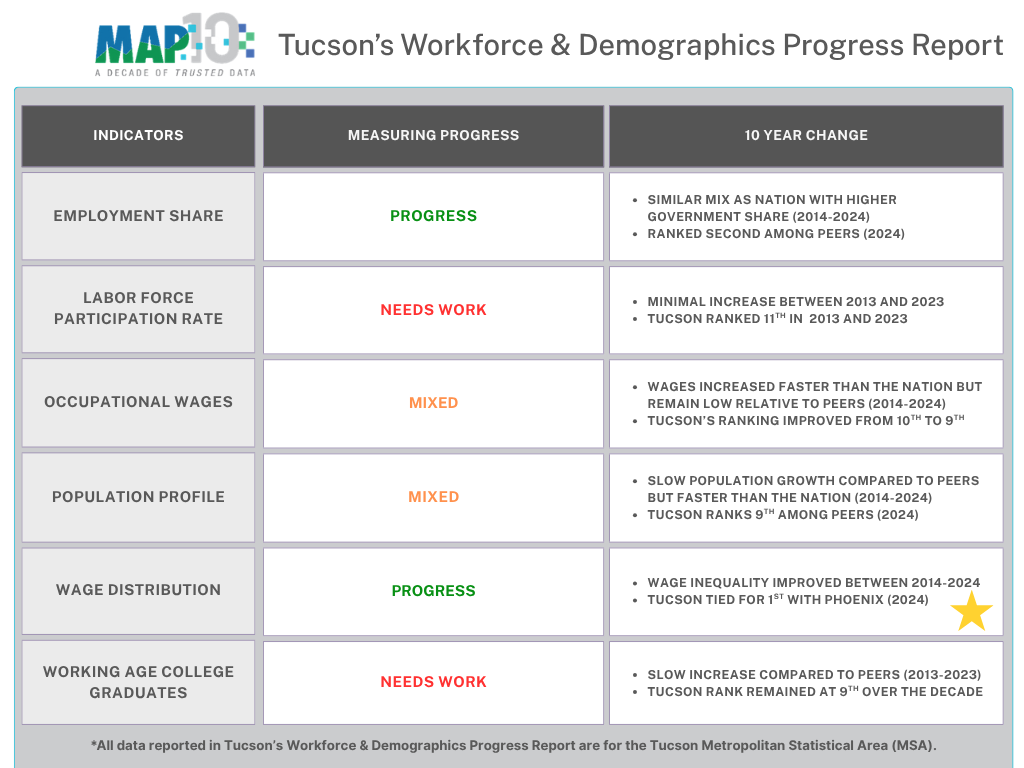
This report measures the progress of Southern Arizona's workforce and demographics. It highlights areas where the region has excelled and identifies areas that still require improvement. The MAP aims to measurably improve Southern Arizona through data-driven collective civic action and education. The data and analysis presented in the MAP Dashboard's Workforce & Demographics category facilitate this by identifying key trends, tracking performance, and informing future policy decisions. The MAP measures progress and inspires action by providing our leaders with facts that inform their decision-making on key issues in Southern Arizona. As the MAP Dashboard celebrates its 10th anniversary, we will examine how workforce and demographics have improved (or not) in our region over the past decade.
Key Changes Over the Past Decade in Workforce & Demographics
Key changes over the past decade are highlighted below for the MAP's workforce and demographic indicators using an interactive graphic. The MAP Dashboard compares the Tucson Metropolitan Statistical Area (MSA) to other peer regions around the West. In some cases, only select regions are included in the interactive graphics to emphasize Tucson’s change. Data for all areas are available under each indicator’s core landing page. They are linked throughout the article.
Employment Share by Industry
In 2024, the employment mix by industry across the Tucson Metropolitan Statistical Area (MSA) was similar to that of the state of Arizona and the U.S. A few notable differences were observed in the shares of Manufacturing; Government; and Trade, Transportation, and Utilities jobs. The Government sector in Tucson accounted for 19.5% of employment, compared to a national share of 14.6%. The average share difference for Tucson relative to the U.S. was 1.2% across all industries. That was the second lowest among peer MSAs in 2024. A difference of 0% would indicate a region had exactly the same share of employment within each industry as the U.S. Las Vegas had the highest difference among the MSAs at 2.9%, but that was nearly a percentage point lower than in 2014. Las Vegas has a high concentration of jobs in the Leisure and Hospitality sector compared to the nation. Portland was the only MSA with an employment mix that was more similar to the nation than Tucson.
Tucson has remained relatively stable over the past decade in its employment mix. Employment share by industry indicates which sectors dominate the employment mix. A large share of government jobs in a region can contribute to increased stability of the business cycles.
Figure 1: Employment Mix Relative to the U.S. (2014-2024)Go to Employ Mix Graph
Labor Force Participation Rate
The Tucson Metropolitan Statistical Area (MSA) had a labor force participation rate of 80.8% among those aged 25 to 54 in 2023. That was the second lowest among peer MSAs, and an improvement of only 1.1 percentage points over the decade. San Diego posted the largest improvement in their labor force participation rate during the last decade, improving from 80.9% to 84.4%. Denver had the highest rate in both 2013 and 2023. Las Vegas was the only MSA to post a decline in its labor force participation rate during the last decade, falling by 1.1 percentage points. Over the past decade, Tucson remained near the bottom of its peers and had slow growth.
Figure 2: Labor Force Participation Rate Among Ages 25 to 54 (2013-2023)Go to Labor Force Participation Rate Graph
*Values are interpolated. That means the values are filled between the actual valid data points. When paused, the visualization only displays actual values.
Occupational Wages
The median wage for all occupations in the Tucson Metropolitan Statistical Area (MSA) in 2024 was $46,450, representing a 42.9% increase from a decade earlier. Tucson’s wage growth was slightly faster than the national rate of 39.3%. Tucson’s ranking among peers improved by one spot between 2014 and 2024, moving ahead of Las Vegas due to its slower wage growth of 36.1%. Nevertheless, Tucson still ranks near the bottom among peer MSAs in wages, with only San Antonio, Las Vegas, and El Paso having lower wages in 2024. Over the past decade, Portland posted the fastest wage growth at 50.3%. Interestingly, San Antonio and El Paso have the second- and third-fastest growth rates at 47.8% and 45.9%, respectively. However, their median wage for all occupations was so low in 2014 that they both remain at the bottom relative to MAP’s peer MSAs.
When examining wages by major occupation in 2024, Tucson falls short of the national median in all but three. Wages were higher for those in the Architecture and Engineering; Protective Service; and Farming, Fishing, and Forestry occupations in Tucson than nationally.
Figure 3: Median Wage for All Occupations (2014-2024)Go to Occupational Wage Graph
Population Profile
The population in the Tucson Metropolitan Statistical Area (MSA) in 2024 was 1,086,634, which was an increase of 8.6% from a decade earlier, when the population was just under 1 million. Tucson had only the eighth-fastest growth among peer MSAs, but was slightly ahead of the U.S. rate of 6.5%. Austin experienced a staggering 31.3% growth rate over the past decade, while Phoenix and San Antonio had the second- and third-fastest population growth rates, at 18.7% and 18.6%, respectively. San Diego had the slowest overall population growth during the past decade at just 1.5%. In fact, San Diego posted three consecutive years of population decline between 2019 and 2021. Tucson’s average annual growth rate of 0.8% over the past decade was faster than only three peer MSAs, San Diego, Albuquerque, and El Paso. Austin has routinely seen year-over-year growth in the high 2% to low 3% range, averaging 2.8% over the past decade.
Figure 4: Population Growth Rate (2014-2024)Go to Population Graph
Wage Distribution
The gap between high-wage and low-wage earners can illustrate the wage inequality within a region. One way to measure this is by comparing the 90th percentile wage (high-income earners) to the 10th percentile wage (low-income earners) as a ratio. In 2024, the 90/10 ratio for the Tucson Metropolitan Statistical Area (MSA) was 3.5. Tucson’s ratio of 3.5 means that wage earners in the 90th percentile earned 3.5 times more than wage earners in the 10th percentile. Tucson had the lowest 90/10 ratio in both 2014 and 2024, a decade later. All comparable MSAs on the MAP reported a decline in the 90/10 ratio over the past decade, except El Paso.
Figure 5: Wage Inequality 90/10 Ratio (2014-2024)Go to Wage Inequality Graph
Working Age College Graduates
In 2013, the Tucson Metropolitan Statistical Areas (MSA)'s four-year college attainment rate for the working-age population (25-64) was 29.2%. That increased by 5.0 percentage points to 34.2% a decade later. Tucson’s increase in the percentage of the working-age population with a college degree was one of the smallest among peer MSAs; only Albuquerque and El Paso increased by a smaller amount. Tucson’s rank among peer MSAs held steady over the decade at ninth. Las Vegas posted the lowest rate of working-age individuals with a college degree in both 2013 and 2023, while Austin had the highest.
Figure 6: Four-Year College Attainment Rate for the Working Age Population (2013-2023)Go to Working Age College Attainment Graph
*Values are interpolated. That means the values are filled between the actual valid data points. When paused, the visualization only displays actual values.
Why is it important?
Indicators in the Workforce & Demographics category help identify the demographic mix and workforce characteristics of Southern Arizona. This data provides government officials, policymakers, and planners with the information necessary to gauge demand for future resources. The type of resources a region may need in the future is highly dependent on its demographic mix and could range from educational needs to infrastructure to services such as healthcare. Population growth is a measure of how well a community attracts and retains residents, reflecting the availability of economic opportunities. The workforce is a subset of the population that refers to those individuals who participate in the labor market. A highly educated and skilled workforce generates greater economic opportunities for a region's residents.
Learn More
To learn more about the Workforce & Demographics category on the MAP Dashboard, visit the overview page. You can view more data and information about the six indicators in the Workforce & Demographics category by clicking on the links below.
Employment Share by Industry
Labor Force Participation Rate
Occupational Wages
Population Profile
Wage Distribution
Working Age College Graduates
Explore the articles already published by clicking on their link below. Stay tuned for the remaining articles, which will measure the progress of each of the MAP’s six categories.
- "Measuring Infrastructure Progress Over the Past Decade"
- "Measuring Education Progress Over the Past Decade"
- "Measuring Health & Social Well-Being Progress Over the Past Decade"


