 Measuring Progress and Inspiring Action in Education
This report measures the progress of education in the Southern Arizona region. It highlights areas where the region has excelled and points out areas that still need work. The MAP aims to measurably improve Southern Arizona by data-driven collective civic action and education. Data and analysis presented in the MAP Dashboard Education category facilitate this by identifying key trends, tracking performance, and informing future policy decisions. The MAP measures progress and inspires action by providing our leaders with facts that inform their decision-making on key issues in Southern Arizona. As the MAP Dashboard celebrates its 10th anniversary, we will look at how education has improved (or not) in our region over the past decade.
Go to Chart Infographic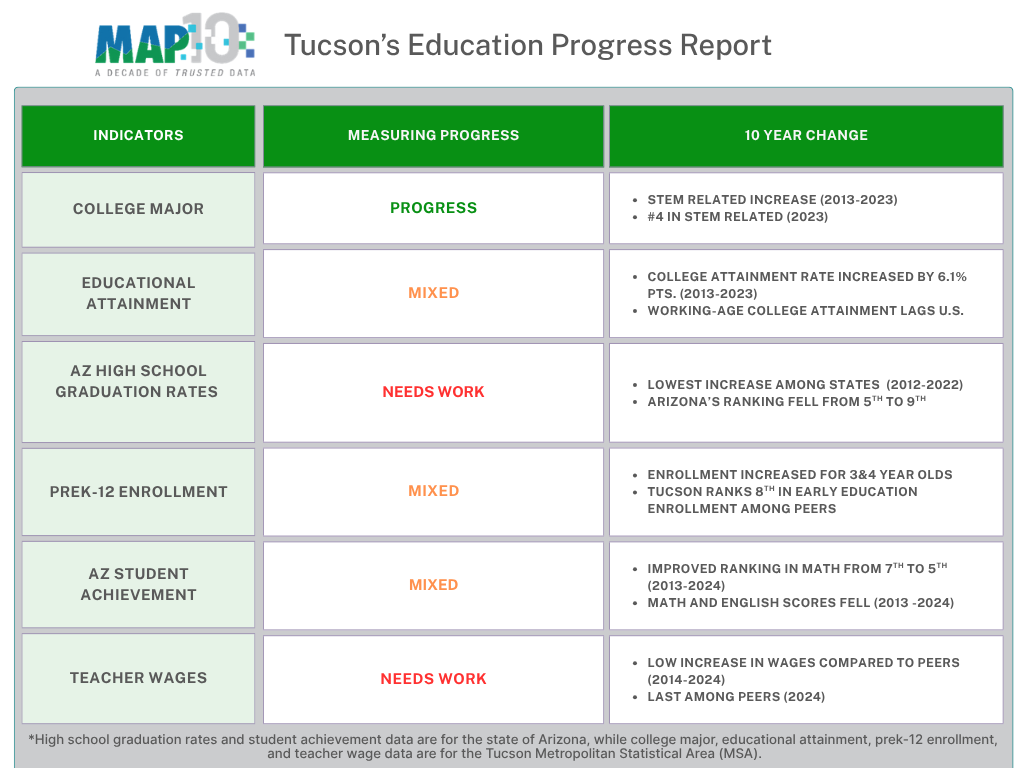
Key Changes Over the Past Decade in Education
Key changes over the past decade are highlighted below for the MAP's education indicators using an interactive graphic. The MAP Dashboard compares the Tucson MSA to other peer regions around the West. In some cases, only select regions are included in the interactive graphics to emphasize Tucson’s change. Data for all areas are available under each indicator’s core landing page. They are linked throughout the article.
College Major
In 2013, 46.6% of college graduates in the Tucson Metropolitan Statistical Area (MSA) reported a science and engineering or related field as their college major. That ranked Tucson fourth out of 12 western MSAs. A decade later, that had increased to 48.8% and Tucson remained in fourth place. Tucson's increase in college majors with a science and engineering or related degree was the seventh fastest among peers. Science and engineering or related degrees accounted for the largest share of college majors in Tucson.
Figure 1: Percent of College Graduates with Majors in Science and Engineering or Related Fields Over the Past Decade (2013-2023)Go to College Grads by Type Graph
*Values are interpolated. That means the values are filled between the actual valid data points. When paused, the visualization only displays actual values.
Educational Attainment
The Tucson Metropolitan Statistical Area (MSA) experienced only a modest increase in the percentage of the population aged 25 and above with a bachelor's degree or higher over the last decade. Tucson's rate of 29.8% in 2013 increased by 6.1 percentage points to 35.9% in 2023. That was similar to the nation but significantly behind peer MSAs like Austin and Denver. Tucson's ranking did improve from 8th to 7th over the decade. However, when broken down by age, the Tucson MSA lags behind its peers for the working-age population (25-64).
Figure 2: Four-Year College Attainment Rates Over the Past Decade (2013-2023)Go to Educational Attainment Graph
*Values are interpolated. That means the values are filled between the actual valid data points. When paused, the visualization only displays actual values.
High School Graduation Rates
Arizona experienced the slowest increase among all the western states in the percentage of public high school students graduating. In 2012, 76.0% of students graduated with their four-year cohort, ranking Arizona fifth among the 10 western states. By 2022, that had increased to only 77.3% and Arizona had fallen to ninth among the western states. Pima County (the same geographic region as the Tucson MSA) fared even worse, with only 72.% of students graduating on time. That was the lowest high school graduation rate of any county in Arizona.
Figure 3: Percent of Public High School Students Graduating in Four Years Over the Past Decade (2012-2022)Go to High School Graduation Graph
PreK-12 Enrollment
In 2023, 40.9% of three-and four-year-olds in the Tucson Metropolitan Statistical Area (MSA) attended an early education program. That ranked Tucson eighth out of peer MSAs. That was a slight improvement from a decade earlier, when Tucson was ranked 10th and only 36.8% of three-and four-year-olds attended. Additional data on public versus private school enrollment and the share of charter schools by state is available on the MAP PreK-12 indicator page.
Figure 4: Percent of Three-and Four-Year-Olds Enrolled in Early Education Over the Past Decade (2013-2023)Go to Early Education Graph
*Values are interpolated. That means the values are filled between the actual valid data points. When paused, the visualization only displays actual values.
Student Achievement
National Assessment of Educational Progress (NAEP) scores are reported every two years at the state level. In 2024, Arizona ranked eighth in fourth-grade reading scores and fifth in eighth-grade math scores. Arizona's ranking remained unchanged in reading from 2013 but improved by two places in math. Arizona has been catching up to the nation in math scores and other peer states, but remains behind in reading. Additional information on state-level testing in Arizona (AASA exam) is available on the MAP core indicator page for Student Achievement. For reference, in 2024, Pima County placed seventh in the percentage of students passing the AASA English Language Arts test and third in the AASA Math test among all Arizona counties.
Figure 5: National Assessment of Education Progress (NAEP) 8th Grade Math Scores Over the Past Decade (2013-2024)Go to Student Achievement Graph
Teacher Wages
In 2024, secondary school teachers in the Tucson Metropolitan Statistical Area (MSA) earned a median wage of $49,050. That was 28.3% higher than a decade earlier, an increase that was well below most of Tucson's peer MSAs. Tucson ranked last among its peers in secondary school teacher wages in 2014 and remained there in 2024. Even when adjusting teacher wages by each region's respective cost of living, Tucson remains at the bottom.
Figure 6: Secondary School Teacher Median Wages Over the Past Decade (2014-2024)Go to Teacher Wage Graph
Why is it important?
Education is one key driver of economic success, both for individuals and for regions. Individuals benefit from education in various ways, including increased productivity, higher wages, improved health outcomes, and reduced need for publicly funded economic assistance. Additionally, research has demonstrated that the benefits of education extend beyond the individual to the region as a whole. Local areas with high concentrations of highly educated residents tend to have better aggregate socioeconomic outcomes, including higher per capita income, lower crime rates, and faster job and population growth. Therefore, less educated residents also benefit by locating in regions with high educational attainment rates.
Learn More
To learn more about the education category on the MAP Dashboard, visit the overview page. You can view more data and information about the six indicators in the education category by clicking on the links below.
College Major
Educational Attainment
High School Graduation Rates
PreK-12 Enrollment
Student Achievement
Teacher Wages
Explore the articles already published by clicking on their link below. Stay tuned for the remaining articles measuring the progress of each of the MAP’s six categories.


