Did you know that the MAP explores race and ethnicity data across a wide selection of indictors? The list is long and includes Median Household Income, College Major, Educational Attainment, High School Graduation Rates, Student Achievement, Health Insurance Coverage, Poverty Rate, Internet Access, and Population Profile. Let’s take a few minutes to highlight the data and key connections for the Tucson Metropolitan Statistical Area (MSA).
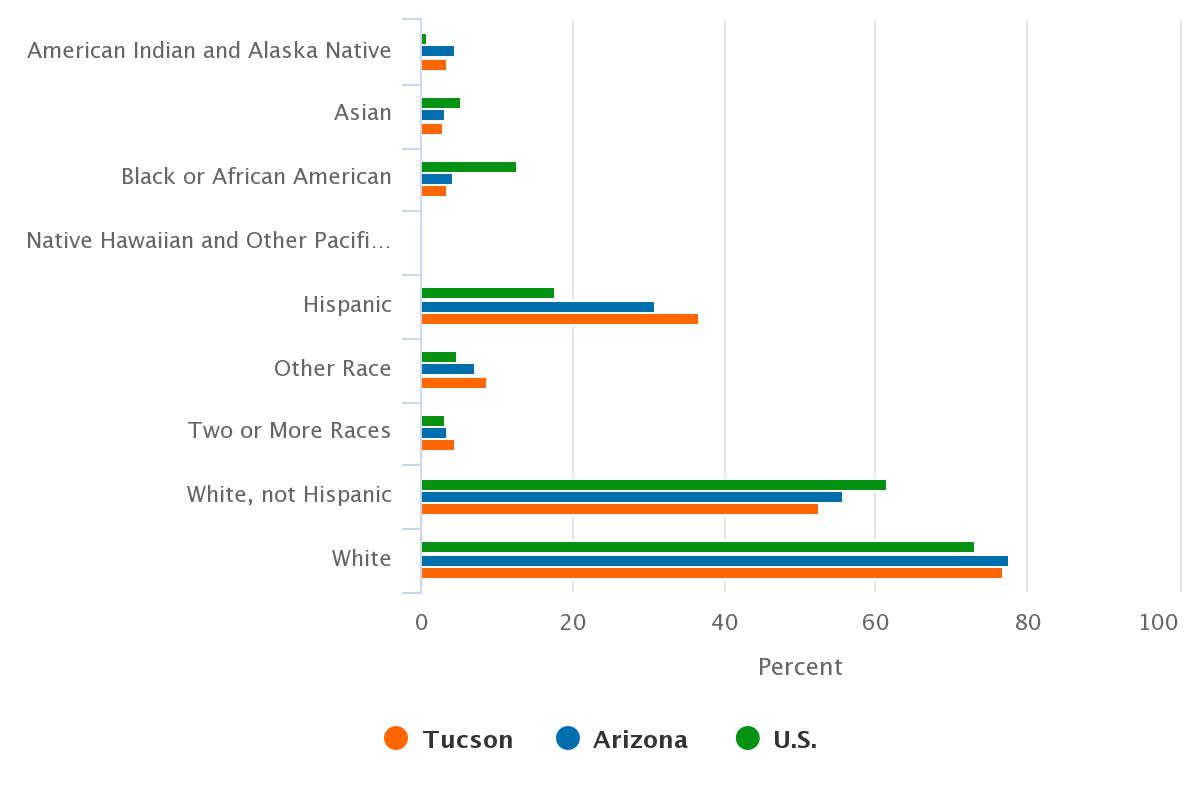
In 2016, the Hispanic or Latino population of Tucson (36.1%) exceeded the national rate of 17.3% by nearly 20 percentage points as illustrated in Figure 1. The state of Arizona posted a similar rate at 30.5% (click on Arizona in Figure 1 to view data). Additionally, Tucson had a high percentage of those who identify as American Indian and Alaska Native when compared to the U.S. However, Tucson’s Black or African American and Asian populations were significantly lower than the nation.
Figure 1: Population by Race & Ethnicity (2016)
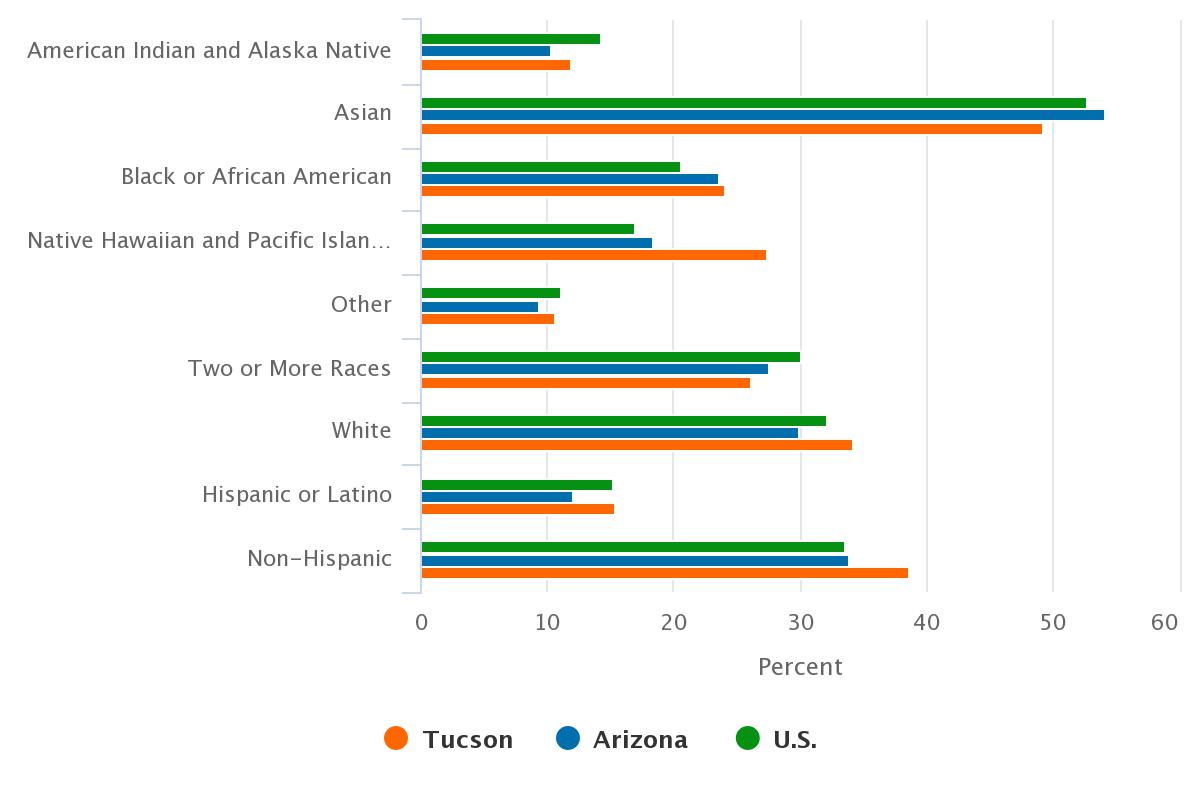
Educational attainment is one key driver of state and local growth. Race and ethnicity data on the MAP show that student achievement scores, graduation rates, and four-year college attainment rates for the Hispanic or Latino population lag behind their non-Hispanic or Latino peers. High school graduation rates in Arizona for the Hispanic or Latino population during 2016 was 76.4% compared to 84.0% for whites and 89.0% for Asians. Further, the Hispanic or Latino population had one of the lowest four-year college attainment rates in Tucson during 2016 at 14.4%, while the non-Hispanic or Latino rate was 37.7% (Figure 2). When exploring residents with a bachelor’s degree or better in Tucson, those who are Hispanic or Latino were less likely to hold a degree in a STEM related field. Clearly, education outcomes for the Hispanic or Latino population represent an opportunity for improvement nationally, in Arizona, and in Tucson.
Keep in mind that education levels influence a broad range of economic and social outcomes, including innovation, wages and income, jobs, health, and other key metrics of socio-economic performance.
Figure 2: Four-Year College Attainment Rates for Those Aged 25+ (2016)
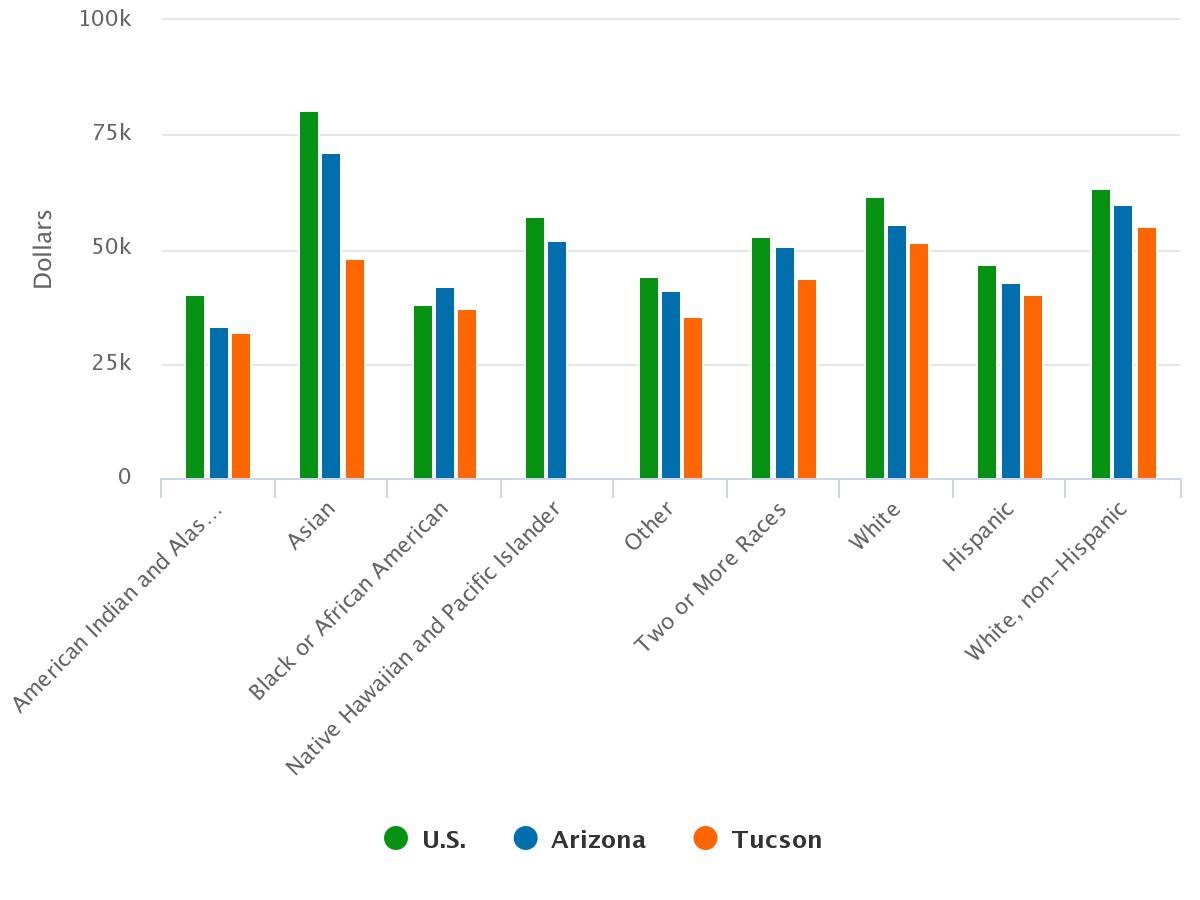
Household income and poverty rates also vary significantly by race and ethnicity. In 2016, white, non-Hispanics had a median household income of $52,905, the highest among all races and ethnicities. Tucson residents who identified themselves as Black or African American and Hispanic or Latino had median household income levels near $37,000, while American Indian and Alaska Natives posted the lowest median household income at $30,308. To explore income data for race and ethnicity see Figure 3 below.
Figure 3: Median Household Income by Race & Ethnicity (2016)
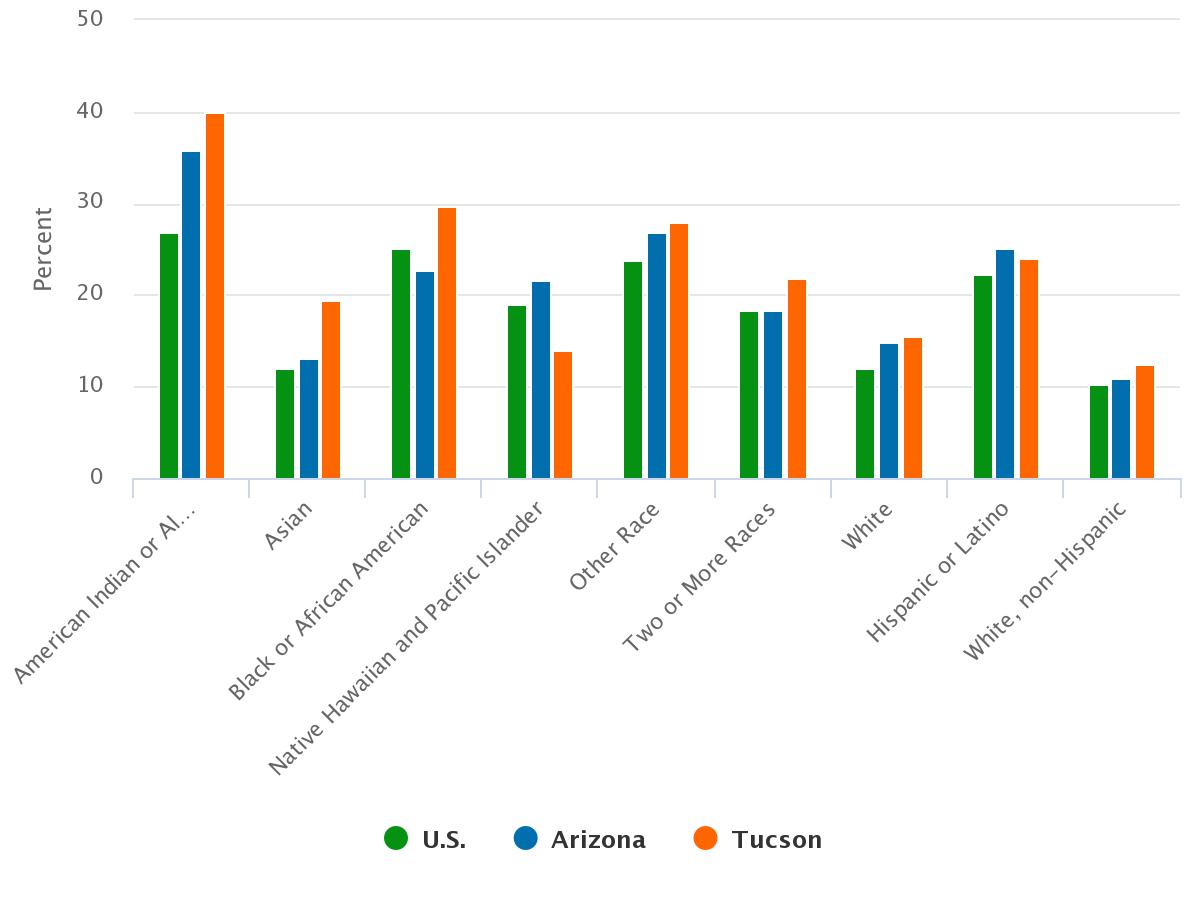
A similar pattern to the income data is present in the poverty data. In 2016, the poverty rate for American Indian and Alaska Natives was 38.5% the highest among all races and ethnicities. Black or African Americans and Hispanics or Latinos had rates near 26.5%, while white, non-Hispanics individuals had the lowest rate at 12.8%, as Figure 4 shows.
Figure 4: Poverty Rate by Race & Ethnicity (2016)
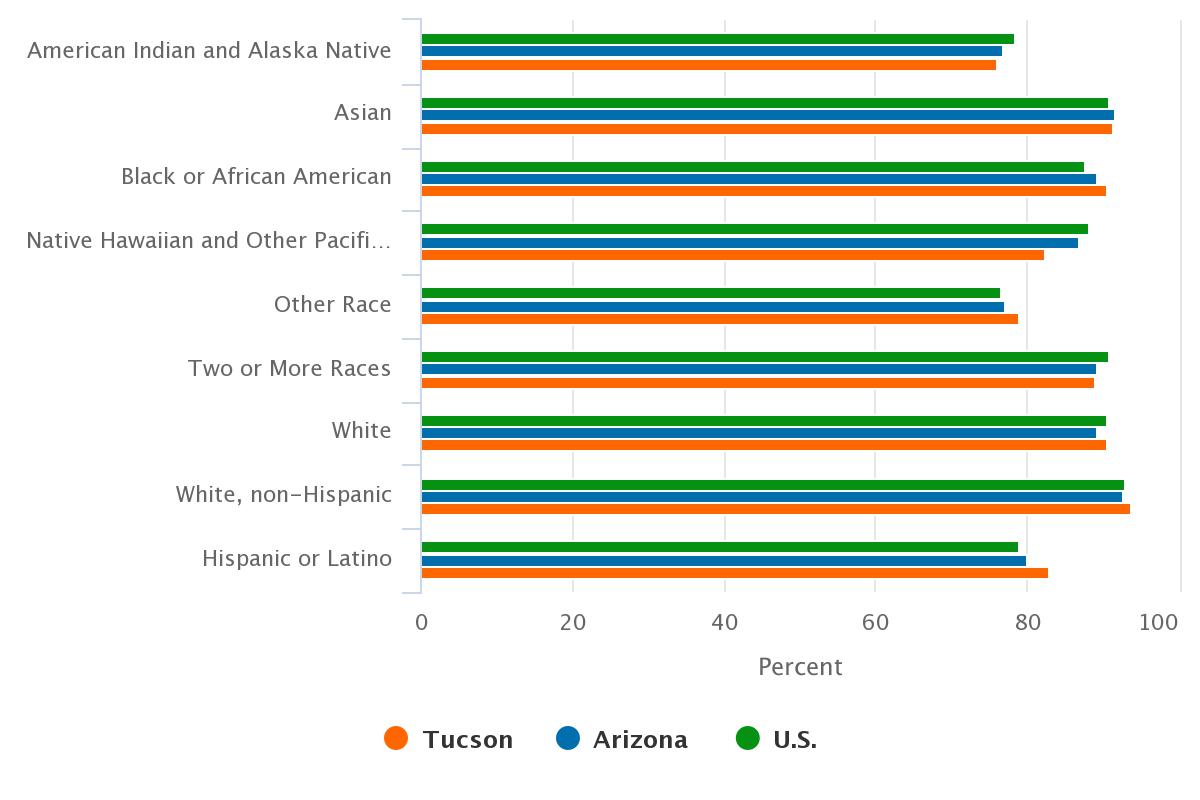
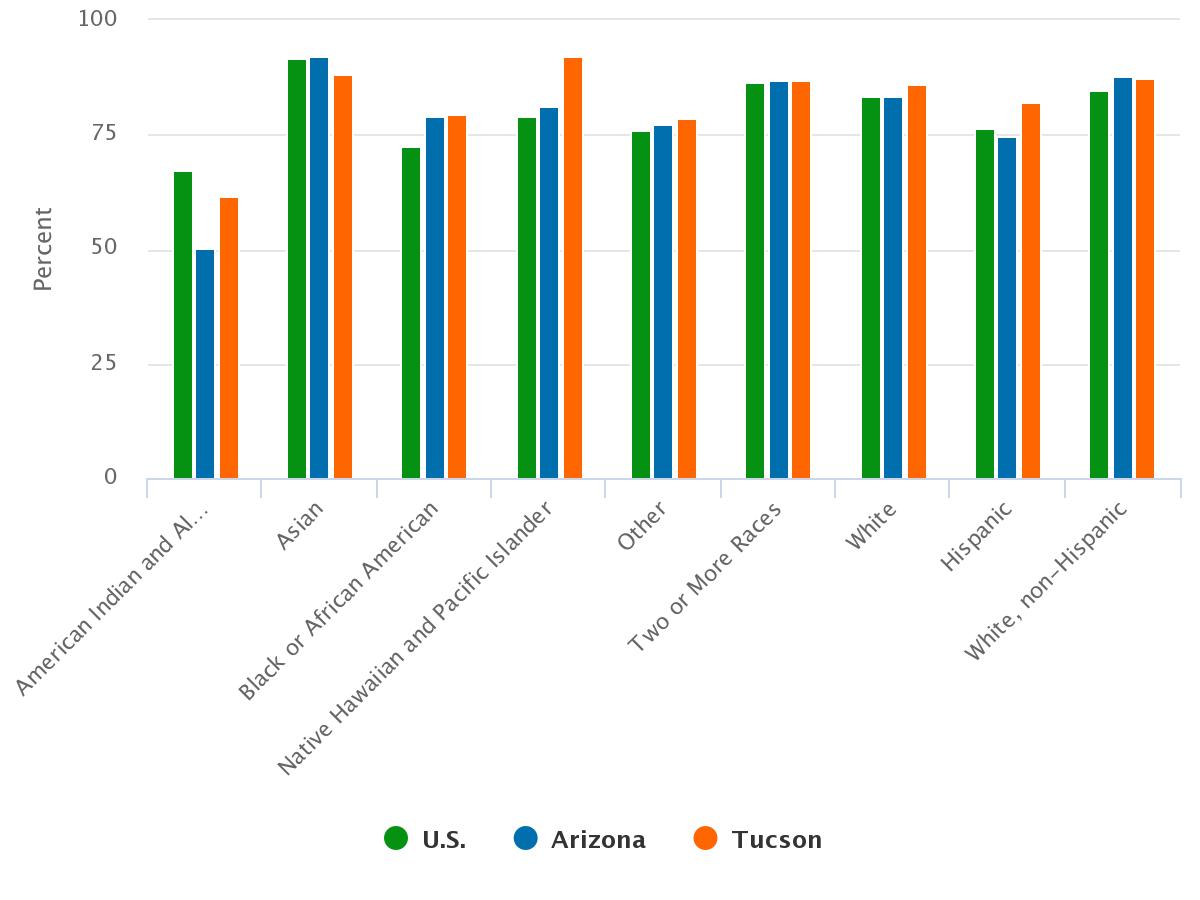
In turn, income and poverty likely influence health insurance coverage. In Tucson during 2016 individuals who reported their race as white, Black or African American, and Asian had high levels of health insurance coverage at 89.5%, 89.3%, and 88.6% respectively. Those who identified as Two or More Races also had high levels of health insurance coverage at 87.0%. The Hispanic or Latino population in Tucson had health insurance coverage rates of 81.2% while American Indian and Alaska Natives posted a rate of 73.7% (Figure 5).
Figure 5: Health Insurance Coverage by Race & Ethnicity (2016)
In 2016, nearly every race and ethnicity in Tucson fared better than the nation in terms of internet access. The rate for Black or African Americans living in Tucson was 88.7% compared to the national average for Black or African Americans of 77.4%. Asians and American Indian and Alaska Natives were the only races to report lower rates than their national peers. Those who reported that they were Two or More Races had the highest internet access rates in Tucson at 95.2%. To explore race and ethnicity by internet access see Figure 6.
Figure 6: Internet Access by Race & Ethnicity (2016)
Additional race and ethnicity data is explored at the city level for select indicators. Recent Southern Arizona cities and town reports include the 2015 Education Report and the 2015 Poverty Report.


