 How Does Health Vary Across the Life Span in the Tucson, Arizona MSA
Life span is one of the most fundamental indicators of a community’s overall health and well-being. It reflects not only longevity, but also the conditions that shape people’s lives; access to care, safe environments, economic opportunity, and social connections. This article, the second in our community health series, examines how life span helps assess health across Arizona and the broader MAP region. By understanding the factors that influence longevity, we can better identify strategies that support longer, healthier lives for all.
Life Expectancy Across Arizona and Western Metro States: What the Numbers Reveal
Life expectancy provides a snapshot of overall population health and varies widely across metropolitan areas in the western United States. Figure 1 compares life expectancy across 12 western Metropolitan Statistical Areas (MSAs) in 2022.
In 2022, San Diego had the highest life expectancy among the 12 western MSAs, at 80.3 years. Austin (78.6), Salt Lake City (78.5), and Denver (77.6) followed closely. Phoenix ranked fifth at 77.5 years, while Tucson was sixth at 76.5 years. Las Vegas had the lowest life expectancy at 72.1 years, a full 8 years lower than San Diego. This variation highlights significant differences across metropolitan areas in average life span, based on the 2025 County Health Rankings data, which reflect a three-year average from 2020 to 2022.
Figure 1: Life Expectancy by Metropolitan Area by MSAs (2022)
Understanding Life Span in Population Health
According to the County Health Rankings & Roadmaps, life span is “the period between birth and death” and is a fundamental measure of a community’s overall health. Because it captures the combined effects of social, economic, environmental, and health care factors, life span provides insight into differences in health outcomes across populations and highlights where early mortality may be shortening lives.
Economic, social, and environmental factors all play a significant role in shaping life span. Social determinants, such as income and education, are closely linked to health outcomes. For example, among adults who survive to age 18 , those with at least a master’s degree can expect to live 14.7 more years than those with less than a high school education, and 8.3 more years than those with a high school education1.
Environmental conditions, including pollution exposure, housing quality, and neighborhood safety, also influence life expectancy by affecting chronic disease risk, injury, and overall well-being.
Premature Mortality Across Western MSAs
To assess life span, several related measures capture both longevity and early mortality. Life expectancy reflects the average number of years people are expected to live, while premature age-adjusted mortality measures deaths among residents under age 75 per 100,000 people. Child mortality captures deaths among residents under age 20 per 100,000 population, and infant mortality measures deaths within the first year of life per 1,000 live births. Together, these measures allow comparisons across Arizona counties and the 12 western MSAs while highlighting how early mortality shapes overall life span.
In 2022, the number of deaths among residents under 75 (adjusted for age) varied widely across the 12 MSAs, from 294.0 per 100,000 people in San Diego to 630.6 in Las Vegas. Phoenix fell in the middle with a rate of 401.0 (5th lowest), while Tucson ranked 9th with a higher rate of 451.3.
Figure 2: Number of deaths among residents under age 75 per 100,000 population (age-adjusted) by Metropolitan Area by MSAs (2022)
Figures 1 and 2 show a clear relationship between premature mortality and life expectancy: areas with higher premature death rates tend to have lower life expectancy. For example, San Diego had the lowest premature mortality and highest life expectancy, while Las Vegas showed the opposite pattern.
Recent national estimates released by the Centers for Disease Control and Prevention (CDC) show that U.S. life expectancy increased in the most recent year available. While these national trends provide important context, the analysis presented here focuses on metropolitan comparisons using County Health Rankings data covering 2020–2022.
Child Mortality in Arizona
In 2022, Arizona’s child mortality rate was 56.9 deaths per 100,000 residents under age 20, slightly higher than the U.S. rate of 51.6. Within the state, there were significant differences across counties. La Paz County recorded the highest rate at 112.5, followed by Apache (85.6), Navajo (82.5), and Gila (81.0), all well above both the state and national averages. In contrast, Santa Cruz County had the lowest rate at 43.6, well below the national value. Large counties such as Maricopa (54.3) and Pima (56.9) were near or slightly above the state average. These differences highlight substantial disparities in child mortality outcomes across Arizona.
Figure 3: Number of deaths among residents under age 20 per 100,000 population (Child Mortality Rate) by Arizona Counties (2022)
For decades, the Infant Mortality Rate (IMR) in the United States has been higher than in many other developed nations. In 2021, the United States reported 5.4 infant deaths per 1,000 live births, compared with an average of about 4.0 per 1,000 live births across countries in the Organization for Economic Co-operation and Development (OECD). This placed the U.S. 33rd out of 38 OECD countries, with only a few countries reporting higher infant mortality rates.
In 2022, the infant mortality rates across Arizona counties showed notable variation, with some counties experiencing significantly higher rates than both the state and national averages of 5.6 per 1,000 live births. For instance, Gila County has the highest infant mortality rate at 9.2, followed closely by Apache (8.6) and Navajo (8.4) counties. In contrast, Santa Cruz reported the lowest rate (5.0).
Overall, while Arizona’s average aligns with the U.S. rate, disparities between counties highlight areas where focused public health efforts could help reduce infant mortality.
Figure 4: Number of infant deaths (within 1 year) per 1,000 live births (Infant Mortality Rate) by Arizona Counties (2022)
Looking Ahead: The Future of Life Expectancy in the U.S.
While this article focuses on current trends in life span across Arizona and the MAP region, it is also important to consider what the future may hold. Recent national forecasts suggest that progress in life expectancy could slow significantly in the coming decades, raising new concerns for public health planning and equity.
A recent analysis from the Institute for Health Metrics and Evaluation (IHME) predicts that U.S. life expectancy gains may stall by 2050, largely due to worsening chronic disease, behavioral risks, and persistent disparities.
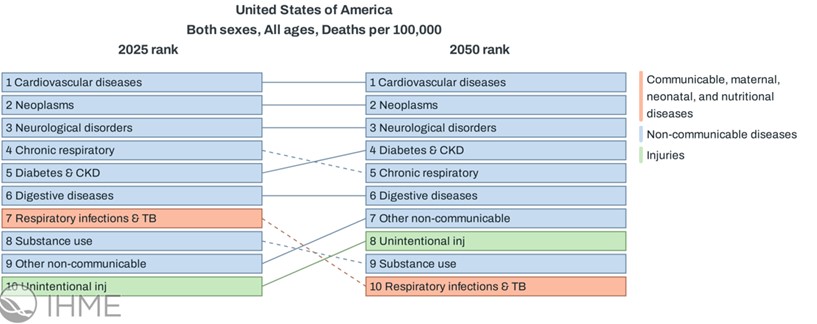
According to projections from the Institute for Health Metrics and Evaluation (IHME), figures 5 and 6 illustrate changes in the leading causes of death in the United States, measured per 100,000 people for both sexes and all ages. Causes of death are grouped into three categories: non-communicable diseases (blue), injuries (green) and communicable, maternal, neonatal, and nutritional diseases (orange).
Figure 5 compares 1990 to 2025, while Figure 6 projects change between 2025 and 2050. From 1990 to 2025, non-communicable diseases have consistently dominated mortality rankings. Respiratory infections and tuberculosis, the only communicable disease in the top seven, remained in 7th place. A notable change is the sharp rise of substance use as a cause of death, moving from 14th place in 1990 to 8th in 2025, while self-harm and violence dropped from 8th to 11th.
Looking ahead to 2050, projections suggest that non-communicable diseases will continue to dominate mortality rankings. Diabetes and kidney disease are projected to rise to 4th place, chronic respiratory diseases will fall slightly, and communicable diseases like respiratory infections and tuberculosis will decline in importance. Unintentional injuries are expected to rise from 10th to 8th place, while substance use will drop to 9th.
Figure 5: Changes in Leading Causes of Death in the United States: 1990 vs. 2025 (Deaths per 100,000 Population)
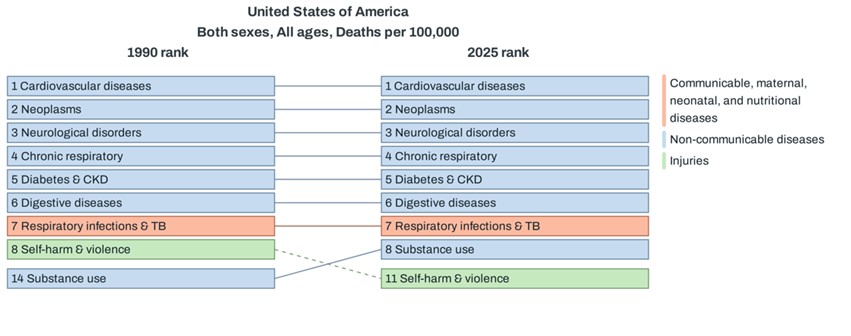
Figure 6: Projected Changes in Leading Causes of Death in the United States: 2025 vs. 2050 (Deaths per 100,000 Population)
Source: Institute for Health Metrics and Evaluation (IHME), Global Burden of Disease Study. Used under Creative Commons Attribution license.
For Arizona, these projections underscore the need to address chronic disease, behavioral risk factors, and persistent health disparities to sustain future gains in life expectancy and improve long-term health.
1Singh GK, Lee H. Marked Disparities in Life Expectancy by Education, Poverty Level, Occupation, and Housing Tenure in the United States, 1997-2014. Int J MCH AIDS. 2021;10(1):7-18. doi: 10.21106/ijma.402. Epub 2020 Dec 30. PMID: 33442488; PMCID: PMC7792745.


