*Please be advised that the MAP Dashboard team has recently learned of new technology used to collect IRI data in 2017, as well as changes to the reporting agency for Arizona. We are currently investigating these changes and the potential impact they may have on the compability of the data over time and across geographic regions. The data presented for 2017 is accurate per the Federal Highway Administration's Highway Statistics Report, but caution is suggested when comparing the urban areas and the trend.
While the first MAP Dashboard “Pothole Index” rated Greater Tucson roads worst among peer urban areas in 2012, road conditions are now showing improvement, based on 2017 regional data and increased investments for pavement maintenance such as voter-approved bonds within the City of Tucson. Efforts by leaders within the region to increase investments where needed or to continue programs that maintain pavement in good condition are showing results.
While more improvement is needed, the percentage of other principal arterials reported in poor condition in the Tucson Urban Area has declined substantially over the past few years. Urban areas are federally defined boundaries that are distinct from metropolitan statistical areas (MSAs), counties, and cities. The Tucson Urban Area includes both the city of Tucson and portions of the county. Further information is provided at the end of the article regarding the definition of an urban area.
The decline in the percentage of other principal arterials rated in poor condition placed Tucson at the top among other peer urban areas in 2017, indicating an improvement for the area. While some of the roads in Tucson have improved that is not the case for much of the U.S., according to The Urban Roads Report. The 2018 report notes that “keeping the wheel steady on America’s roads and highways has become increasingly challenging as drivers encounter potholes and pavement deterioration.” They also point out that one-third of the nation’s major urban roadways are in poor condition.1 Let’s take a look at how the Tucson Urban Area’s roads stack up. Data reported in this article come from the International Roughness Index (IRI) which is the standard indicator of road roughness in the U.S. and elsewhere around the world.2 The data reflect conditions for several types of roadways. For the purpose of this article we focus our discussion primarily on other principal arterials but report data for four main types of roadways: interstates, other freeways and expressways, other principal arterials, and minor arterials. Other principal arterials are particularly important to the Tucson Urban Area because they account for a relatively large share of vehicle miles traveled in the region, nearly 36.0%. Other principal arterials are heavily used urban roads that collect traffic from intersecting residential streets, and direct it toward employment or business centers, freeways, and interstates. Examples of other principal arterials in the Tucson Urban Area are Grant Road and Broadway Boulevard. I-10 is an example of an interstate, while Aviation Highway is a freeway and expressway. Finally, Tucson Boulevard and Pima Street are examples of minor arterials. Additionally, several different ratings of road conditions are explored in this article: poor, mediocre, fair, and good.
Only 19.5% of other principal arterials in the Tucson Urban Area were classified in poor condition in 2017. This ranked Tucson third among comparable urban areas in the West (Figure 1). Salt Lake City reported the lowest percentage of other principal arterials that were rated poor at 12.6%, while San Diego had the highest at 46.7%. Colorado Springs and Denver also had a high percentage of other principal arterials in poor condition at 33.1% and 34.0% respectively. Salt Lake City, Las Vegas, and Tucson were the only urban areas to post rates under 20%.
Figure 1: Percent of Other Principal Arterials Rated Poor (2017)
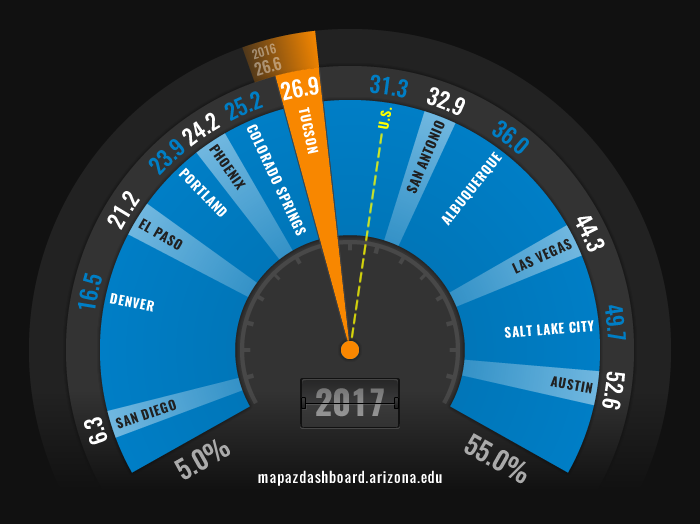
However, Tucson’s ranking fell to sixth when comparing the percent of other principal arterials that had a good rating. In Tucson, 26.9% of other principal arterials were rated good, while 23.2% were fair, 30.5% mediocre, and as mentioned previously, 19.5% were in poor condition*. A good rating indicates a high degree of smoothness on those roads. Figure 2 highlights the percent of other principal arterials that are rated good for select urban areas. The Austin Urban Area ranked first with 52.6% of other principal arterials rated good, while San Diego ranked at the bottom with less than 10.0% rated good. Tucson reported a modest increase of 8.5 percentage points in other principal arterials rated good since 2012.
Figure 2: Percent of Other Principal Arterials Rated Good (2017)
Why is it important?
Pavement quality plays a vital role in traffic flow and commuter comfort. When roads wear out, they must be rehabilitated and resurfaced to maintain smooth driving conditions since rough pavement decreases skid resistance, reducing motorist control under adverse driving conditions. Deteriorated roads also increase user costs, which over time can amount to a significant financial burden on the traveling public. The 2018 Urban Roads Report found that the average motorist in the U.S. is paying $599 annually, a total of $130 billion nationally, in additional vehicle operating costs as a result of driving on roads in need of repair.1 Proper maintenance lengthens the useful life of a roadway, maximizes traffic operations and overall flow, and minimizes repair costs for road users.
Numerous factors are involved when it comes to addressing the quality of roads including funding, climate, jurisdictional boundaries, and user characteristics. State and local governments are primarily responsible for funding roads in the U.S., but the federal government also contributes. In a recent article published by the Mercatus Center at George Mason University they mention that the Highway Trust Fund (HTF) serves as the principal source of federal financing for roads in the U.S., noting that the HTF is primarily replenished by taxes on gasoline and diesel fuel.3 Additionally, the article discusses the Fixing America’s Surface Transportation Act of 2015 (FAST Act) that authorizes surface transportation funding through 2020, with approximately $70 billion from the general fund transferred to finance transportation expenditures.
Limitation and Caveats
According to the Bureau of Transportation Statistics, states are required to report IRI data to the Federal Highway Administration (FHWA) for interstates, other principal arterials, rural minor arterials, and to the National Highway System regardless of functional system. The FHWA recommends IRI over other methods for measuring all other functional classifications because it uses a more standardized and objective measurement methodology.4 The Report “Interpretation of Road Roughness Profile Data” prepared for the Federal Highway Administration notes that the IRI has considerable merit as a summary profile-based roughness index, but some users have noted discrepancies in the reported data.2 Even so, the report noted problems may arise from a lack of a standard procedures for calculating IRI. The problems mentioned include some states averaging the left- and right-hand profiles prior to processing data for a stretch of roadway, thereby obtaining the Half-car Roughness Index (HRI) rather than the IRI. In addition, in some cases the IRI data are statistically smoothed twice by some agencies, resulting in lower IRI numbers. Nonetheless, the authors conclude that the definition of the IRI was reviewed and found to be technically sound despite these problems.
In prior years, limitations to the data also included varying report rates among agencies and the over reporting of data for minor arterials in select urban areas. Significant progress appears to have been made on both these issues. In 2017, all of the urban areas reported IRI data for more than 90% of their roadways with a few exceptions: Albuquerque does not have any miles of other freeways & expressways as part of their roadway system; the Tucson and Phoenix urban areas reported at a rate of 41.6% and 76.2% for their other principal arterials. Additionally, in 2017 there was no over reporting of data for minor arterials.
How do we compare?
In 2017, 25.0% of major roads in the Tucson Urban Area were classified in good condition. Major roads include interstates, other freeways and expressways, other principal arterials, and minor arterials combined. An additional 25.8% were in mediocre condition, 16.2% were rated fair, and 33.0% were classified as poor. When compared among 12 western urban areas, Austin and Las Vegas had the highest percentage of roadways rated good at 49.5% and 48.1% respectively, while Tucson ranked ninth. The percentage of Tucson’s roadways that received a poor rating was slightly higher than the rate for all U.S. urban areas. Figure 3 highlights poor road conditions for all major roadways.
Figure 3: Percent of Major Roads in Urban Areas Rated Poor (2017)
Pavement quality varies significantly by the type of roadway, as Figure 4 below illustrates. For example, 19.5% of other principal arterials in the Tucson Urban Area were rated in poor condition in 2017. In contrast, less than 1.0% of interstates were in poor condition, one of the lowest amongst comparable western urban areas. San Diego, Denver, and Colorado Springs all ranked low in pavement quality for other principal and minor arterials. Salt Lake City reported the lowest percentage of other principal arterials rated poor but the highest percent of minor arterials rated poor. Click on and off the different road types in Figure 4 to view data for each urban area.
Figure 4: Percent Rated Poor by Road Type for Urban Areas (2017)
Motorists are impacted by the pavement quality of the roads they use often. In 2017, 35.5% of vehicle miles traveled (VMT) on major roads in the Tucson Urban Area were on other principal arterials, such as Grant Road. Minor arterials, such as Tucson Boulevard, had a slightly higher volume of vehicle miles traveled than other principal arterials at 36.6%, while freeways and expressways, and interstates were significantly lower at 2.1% and 25.8% respectively. Among 12 western urban areas, Tucson had the highest percentage of vehicle miles traveled on both minor and other principal arterials. A recent article published on the MAP explores vehicle miles traveled for the Tucson Urban Area and how the region compares. To learn more about VMT visit: Putting Miles on Our Cars: How Tucson Stacks Up.
What are the key trends?
The percent of other principal arterials rated poor in the Tucson Urban Area has varied over the last six years, ranging from a high of almost 40.0% to a low of 19.5% in 2017. During the same time, Phoenix posted increases in all but one year in the percentage of other principal arterials rated poor from a low of 0.6% to a high of 30.1% in 2017. U.S. urban areas reported major fluctuations in the percent of other principal arterials rated poor, decreasing by nearly nine percentage points between 2012 and 2015, but then increasing beyond the 2012 rate in 2017. Figure 5 illustrates the trend in road conditions rated poor for select urban areas.
Figure 5: Percent of Other Principal Arterials Rated Poor
How is it measured?
Federal Highway Administration (FHWA) data on pavement roughness by state and urban area are reported as IRI in inches per mile. The IRI is computed by dividing accumulated vehicle suspension motion in inches by the distance traveled in miles. Suspension vibration is gauged with a sensor installed in the wheelbase of a standard vehicle. Lower scores indicate smoother pavement. An IRI score of less than 95 is considered good, while roads with ratings 170 or more are considered poor and in need of repair. Scores between 95 and 119 indicate roads in fair condition while scores between 120 and 169 represent roads in mediocre condition.
Federal-aid urbanized areas include, at minimum, a census designated place with an urban population of 5,000 to 49,999, or a census designated urban area with a population 50,000 or more. Boundaries of federal-aid urban areas may be adjusted to reflect urbanization and transportation needs. Accordingly, they may include densely settled urban areas adjacent to the census designated urban area, as approved by the U.S. Department of Transportation. The Federal-aid boundaries used in the FHWA Highway Statistics reports are determined by responsible state and local officials, subject to approval of the Secretary of Transportation. In Arizona, the Arizona Department of Transportation sets the urbanized areas based on the 2010 Census Smoothed Urban Area. Urban areas differ from metropolitan statistical areas, which are comprised of counties that contain an urban area, as well as adjacent counties that meet certain population density and connectivity requirements.
*Due to rounding may not equal 100%.
References:
- TRIP Urban Roads Report, (2018, October) Bumpy Road Ahead: America’s Roughest Rides and Strategies to Make Our Roads Smoother, TRIP is a national transportation research group, http://www.tripnet.org/docs/Urban_Roads_TRIP_Report_October_2018.pdf
- Sayers, M., and Karamihas, S., (1996) Interpretation of Road Roughness Profile Data, Final Report, Prepared for Federal Highway Administration Contract DTFH 61-92-C00143, http://citeseerx.ist.psu.edu/viewdoc/download?doi=10.1.1.40.5876&rep=rep1&type=pdf
- Krol, R., (2017, August) Federal Highway Funding Needs to Change, Mercatus on Policy Series, State and Local Policy, https://www.mercatus.org/publications/state-and-local-policy/federal-highway-funding-needs-change
- Bureau of Transportation Statistics, Road Condition, https://www.bts.gov/content/road-condition


