In 2016, approximately 12.6% of Arizonans had a disability. The percentage of the population with a disability in Arizona was nearly identical to that of the U.S. (See Table 1 below which provides population characteristics for individuals with a disability in Arizona and the U.S.) Arizona differed from the nation by no more than two percentage points except in one area: Arizona had a lower percentage of American Indians and Alaska Natives with a disability. Arizonans with a disability had a four-year college attainment rate of 17.5%, 1.8 percentage points higher than the nation, though still lower than the population aged 25+ for the state (which was 28.0%).
Table 1: Percent of Population with a Disability, by Characteristics (2016)
| Disability Charateristics | Arizona | U.S. |
|---|---|---|
| Population with a Disability | 12.6% | 12.5% |
| Gender | ||
| Male | 12.7% | 12.4% |
| Female | 12.5% | 12.7% |
| Age | ||
| 75 years of age and over | 48.0% | 50.0% |
| Race & Ethnicity | ||
| White | 13.2% | 13.0% |
| Black or African American | 12.3% | 14.0% |
| American Indian and Alaska Native | 13.4% | 16.6% |
| Asian | 7.1% | 6.9% |
| Native Hawaiian/Pacific Islander | 8.9% | 10.4% |
| Some Other Race | 9.3% | 8.1% |
| Two or More Races | 10.8% | 11.0% |
| White, not Hispanic or Latino | 14.9% | 13.7% |
| Hispanic or Latino | 8.9% | 8.8.% |
| Education | ||
| Bachelor's Degree or Better (pop. 25 and over) |
17.5% | 15.7% |
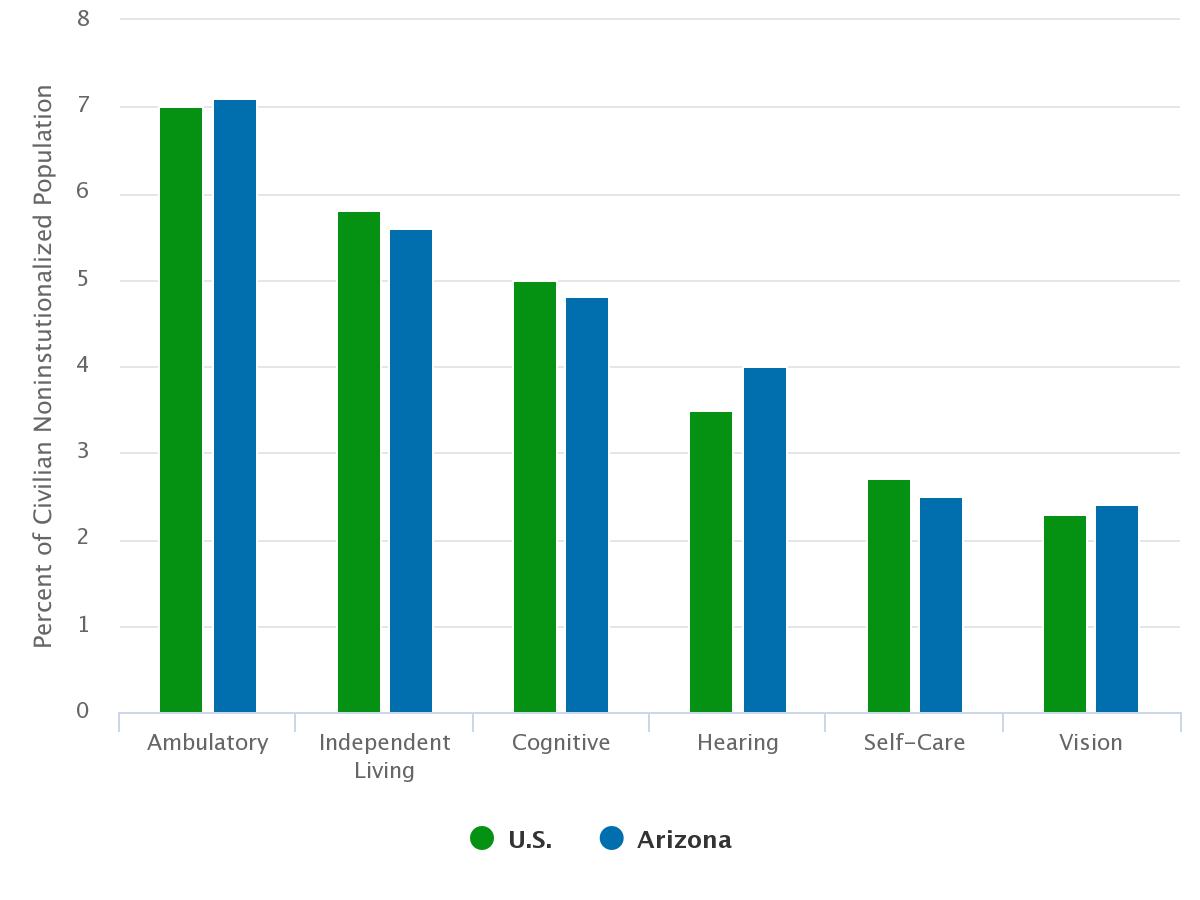
Types of disability
The Census Bureau designates disabilities using six different types: hearing, vision, cognitive, ambulatory, self-care, and independent living. An individual who reports any one of the six types is considered to have a disability. Ambulatory disability, described as having serious difficulty walking or climbing stairs, is the most common reported in Arizona at 7.1%, as illustrated in Figure 1. It is followed by independent living at 5.6%, which is having difficulty doing errands alone such as visiting a doctor’s office or shopping because of physical, mental, or emotional problems. Individuals with a cognitive disability have difficulty remembering, concentrating, or making decisions because of physical, mental, or emotional problems. In Arizona, 4.8% of the population has a cognitive disability. Self-care disabilities are present in 2.5% of Arizona's population and include difficulty bathing or dressing.
Figure 1: Type of Disability (2016)
Employment
The population of 18 to 64 year olds in Arizona was 3.9 million in 2016, which encompasses the principal working ages for most individuals. Of that number, 223,000 Arizonans had one type of disability while 184,000 had two or more types of disability, resulting in 10.3% of the 18 to 64 year-old population with a disability. Employment rates were substantially lower for individuals that had a disability than those without, 34.1% and 72.6% respectively. The same held true for the percent working full-time, which was 20.9% for people with a disability compared to 52.1% for those without. A larger portion of people with disabilities were not in the labor force - in other words, not looking for work. Median earnings for those aged 16 years and older reflect less pay for individuals that have a disability. Table 2 highlights select employment characteristics for those with and without a disability.
Table 2: Employment Characteristics with and without a Disability in Arizona (2016)
| Employment Characteristics | With a disability | without a disability |
|---|---|---|
| Age 18 to 64 | 406,698 | 3,537,669 |
| Employed | 138,525 | 2,568,263 |
| Unemployed | 26,908 | 202,445 |
| Not in the labor force | 241,265 | 766,691 |
| Percent Employed | 34.1% | 72.6% |
| Percent working full-time, year round | 20.9% | 52.1% |
| Percent not in the labor force | 59.3% | 21.7% |
| Median Earnings, age 16+ | $21,226 | $30,599 |
In 2016, people with disabilities in Arizona were more likely to work in a non-profit organization or be self-employed. They also had a slightly higher tendency to work in state and federal government positions. A higher percentage of the population with a disability when compared to the total population were employed in service occupations, sales and office occupations, as well as production, transportation, and material moving occupations. This follows a similar pattern at the industry level where a higher percentage of individuals with disabilities worked in retail trade, transportation and warehousing, other services, and public administration. The ‘other services’ industry contains sectors such as repair and maintenance establishments, personal services (from beauty salons to funeral homes to pet care), and civic and social advocacy organizations. Here again, Arizona tracks closely to that of the U.S. in most areas. One exception being that individuals with disabilities in Arizona were more likely than those in the U.S. to work in the professional, scientific, and management sector.
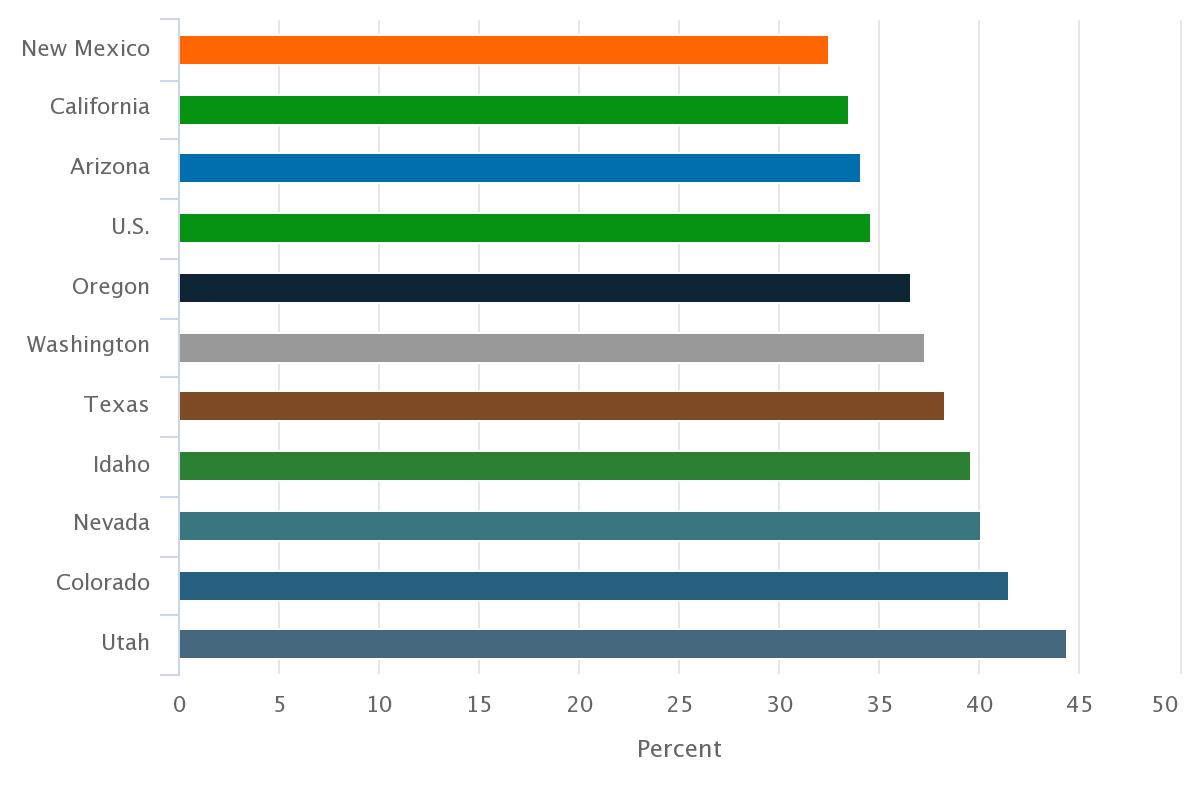
Arizona's employment rate of 34.1% for individuals with a disability in 2016 was slightly less than the U.S. at 34.6%. However, Arizona's rate fell far behind the rate of other states. In fact, Arizona ranked 32nd out of all states and eighth out of the 10 MAP Dashboard states. North Dakota ranked the highest with 52.1% and West Virginia was last with only 26.0% employed. Figure 2 highlights the percent of the population with a disability that are employed for the MAP Dashboard states.
Figure 2: Employment Rates for the Disabled Population (2016)
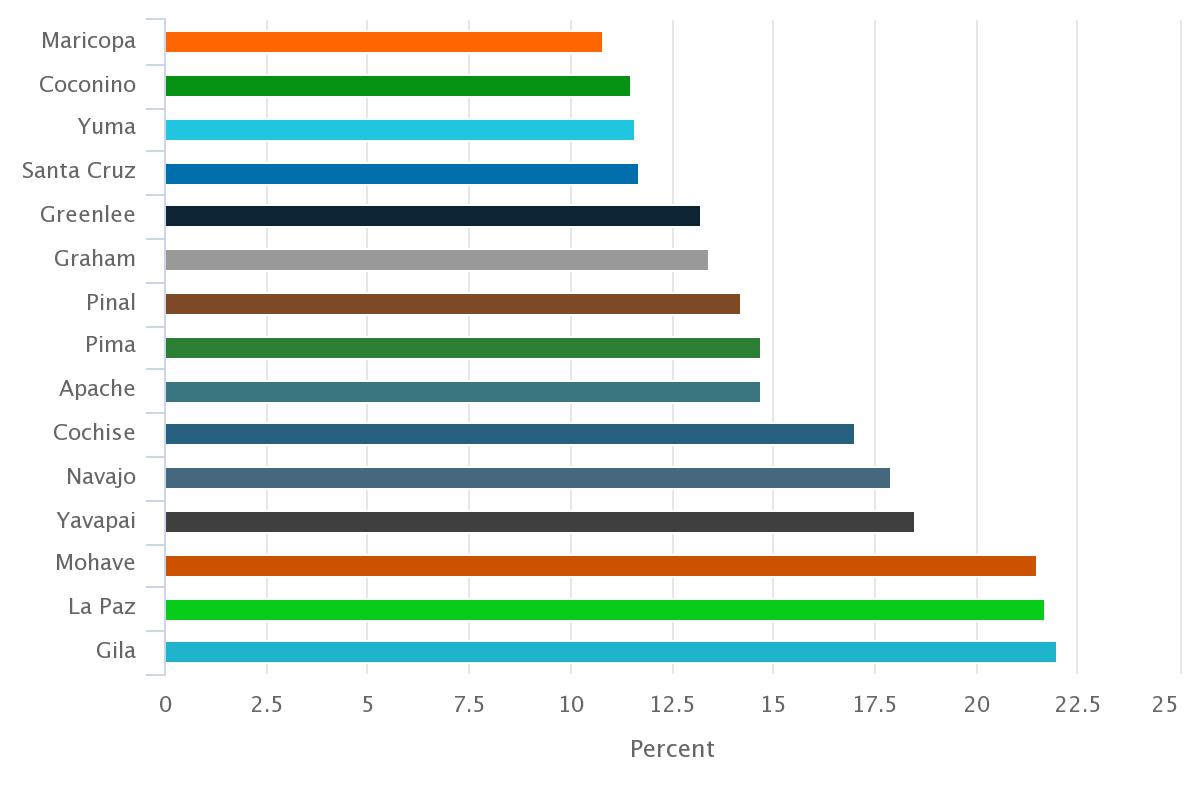
Arizona counties
This article has focused on state level data primarily because detailed data on disabilities at the county-level had margins of error outside the parameters which we are comfortable publishing. Totals for Arizona counties are available, however, and are worth noting. The proportion of the population with a disability ranges from 10.8% in Maricopa to 22.0% in Gila. When reviewing the disability data in Figure 3, keep in mind the possibility of large margin of errors for select counties.
Figure 3: Percent of the Population with a Disability (2016)
Source
Disability status data come from the 2016 American Community Survey (ACS) 5-year estimates published by the U.S. Census Bureau. The Census Bureau changed the way they handled questions on disability in the 2008 ACS, so current data are not comparable to previous ACS releases or to the Census 2000.


