The foreign-born population in the U.S. has steadily increased over the past 50 years. According to the U.S. Census Bureau, the foreign-born population in 1970 was 9.6 million, representing 4.7% of the total U.S. population. The latest data from the Census Bureau’s American Community Survey (ACS) one-year estimates reported a foreign-born population of nearly 48 million in 2023, or 14.3% of the U.S. population. The foreign-born population includes anyone living in the U.S. who was not a U.S. citizen at birth.
The foreign-born population share varies widely across U.S. states. In 2023, California reported the largest share at 27.3%, while New Jersey and New York followed closely at 24.2% and 23.1%, respectively. West Virginia, Montana, and Mississippi reported the smallest share of foreign-born populations. Arizona ranked 15th highest in foreign-born population share at 13.2%. Figure 1 represents the share of the foreign-born population in 2023 by state. The figure is broken into quintiles using a gradient color scheme, with dark blue representing the highest share and light yellow the lowest.
Figure 1: Share of Foreign-Born Population (2023)
Among the western Metropolitan Statistical Areas (MSAs) tracked on the MAP Dashboard, San Diego reported the highest share of foreign-born population in 2023 at 23.1%. El Paso and Las Vegas followed closely at 22.5% and 22.1%, respectively. Tucson reported the third-lowest share of the foreign-born population at 12.2%, while Colorado Springs had the lowest share at 6.8% (Figure 2).
Figure 2: Share of Foreign-Born Population for Select MSAs (2023)
The foreign-born population within Arizona varied significantly, with the counties in the southern half of the state reporting a much higher share. Santa Cruz County reported the highest share at 33.4%, while Yuma followed at 24.7%. Maricopa and Pima counties reported the next largest shares at 14.5% and 12.2%, respectively. Apache County reported the lowest share at 1.6%. Figure 3 represents the share of the foreign-born population in 2022 for each Arizona county. The figure is broken into quintiles using a gradient color scheme, with dark blue representing the highest share and light yellow the lowest. Note: The data for the Arizona counties is from 2022, as the five-year ACS Census estimates are not yet available for 2023.
Figure 3: Share of Foreign-Born Population for Arizona Counties (2022)
Nationally, the share of the foreign-born population has increased over time. In 2005, the foreign-born population represented 12.4% of the U.S. population. That share steadily increased over the next 18 years and was 14.3% in 2023. In Arizona and Phoenix, the share of the population that was foreign-born peaked in 2007, subsequently falling by several percentage points over the next few years. Tucson’s foreign-born population peaked at 13.6% in 2019, then declined sharply to 11.4% in 2021. Figure 4 highlights the share of the foreign-born population from 2005 to 2023. To view data for a grayed-out state or metro, click on the name of the geography.
Figure 4: Share of Foreign-Born Population (2005-2023)
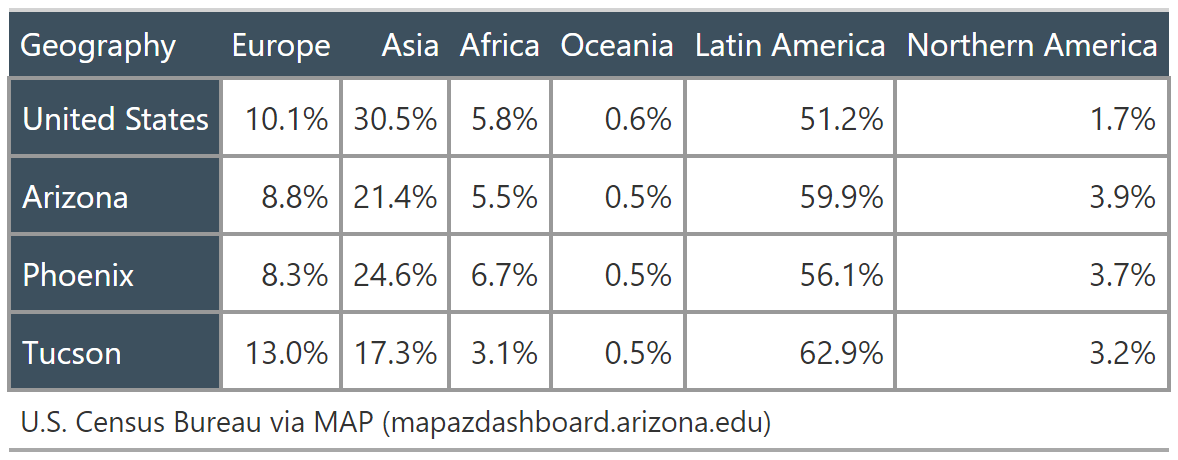
In 2023, more than half of the foreign-born population in the U.S. was from Latin America. Those from Asia represented the second largest share of the foreign-born population, followed by Europe, Africa, Northern America, and Oceania. The birthplace of the foreign-born population followed a similar pattern for the Tucson MSA, as illustrated in Figure 5.
Figure 5: Birth Place of Foreign-Born Population by Percentage (2023)

Nationally, 47.8% of the foreign-born population in 2023 were not U.S. citizens. That was slightly less for the Tucson MSA at 44.6%. Tucson had the third-lowest percent of foreign-born population that were not U.S. citizens. San Diego reported the lowest at 40.4%, while Salt Lake City had the highest at 58.1% (Figure 6). The data reported here reports estimates on the percent of the foreign-born population that are not U.S. citizens. We can’t infer from this data if those foreign-born individuals are living in the U.S. legally or if they are undocumented. The Census does not ask questions on the legal status of residents.
Figure 6: Percent of Foreign-Born Population Not a U.S. Citizen (2023)
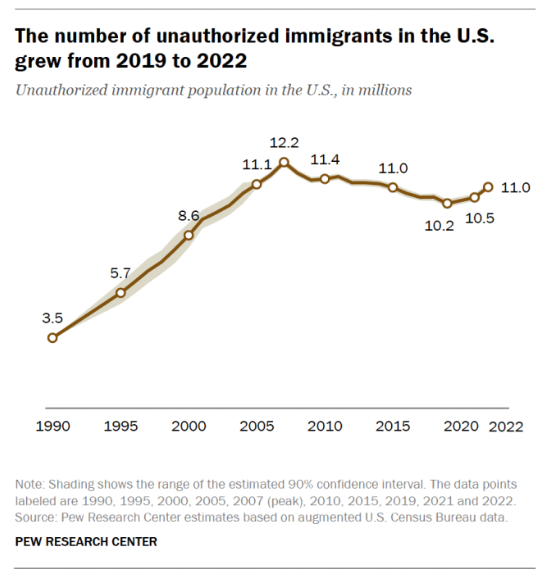
There is a lot of talk in the media and politics about undocumented immigrants. We do not have government data sources that publicly report data on this topic. The Pew Research Center recently published an article “What we know about unauthorized immigrants living in the U.S.” In mid-2022, the Pew Research Center estimated that there were 11.0 million unauthorized immigrants living in the U.S. That was lower than their estimated peak of 12.2 million in 2007. They expect the number of undocumented immigrants to increase between 2022 and 2024 due to record encounters with migrants at the U.S. border and the number of applicants waiting on asylum decisions. Figure 7 highlights the Pew Research Center’s estimates of the number of undocumented immigrants in the U.S.
Figure 7:

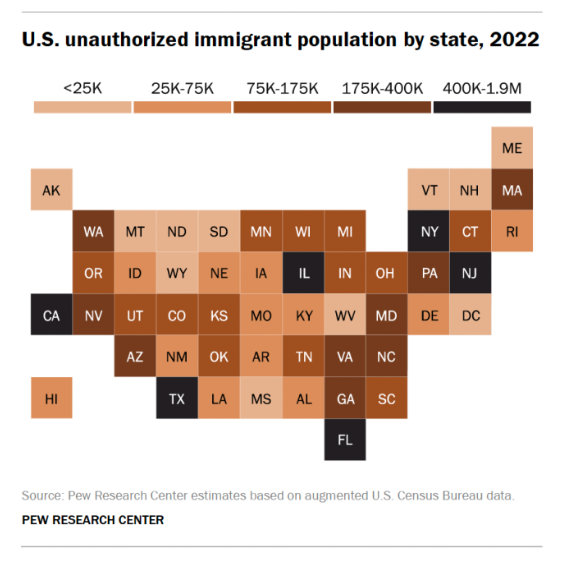
The Pew Research Center also reported estimates of undocumented immigrants at the state level. The six states with the largest unauthorized immigrant populations in 2022 were California, Texas, Florida, New York, New Jersey, and Illinois. As Figure 8 shows, Arizona’s estimated unauthorized immigration population for Arizona was 250,000, which represents 3.5% of the state’s total population.
Figure 8:

The MAP Dashboard will continue to publish data and information that is relevant to southern Arizona. Stay tuned for upcoming articles on how Tucson has changed over the past 75 years, manufacturing and wage trends, and how many homes in our area are rentals.


