In 2017, trade with Mexico via Arizona border ports of entry (BPOEs) reached $28.0 billion for the U.S., which was a decrease of $2.3 billion, or 7.6 percent, over a year ago. The decline in total trade last year was driven by both imports and exports. A key driver of the decline in exports was the appreciation of the U.S. dollar versus the peso. The decline in imports is harder to explain and is likely influenced by a wide variety of factors, which may possibly include the current political discussions about international trade.
U.S. exports to Mexico via Arizona BPOE totaled $11.0 billion in 2017, down $900 million, or 7.7 percent from a year ago. Arizona was the top exporter through its own ports in 2017, followed by Michigan, California, Texas, and Illinois. Michigan's rank in the list is due to the robust cross-border production sharing system that exists in the North American automotive industry. In 2017, Michigan’s top seven imports to and exports from Mexico were related to automobile manufacturing.1 Exports to Mexico via Arizona BPOE by state are displayed in Figure 1 below. To view the history, click the “trend” tab.
Figure 1: Exports to Mexico via Arizona Border Port of Entry by State
In 2017, U.S. imports from Mexico through Arizona BPOE totaled $17.0 billion, which was down $1.4 billion, or 7.4 percent, from a year ago. Arizona was the top importer of goods from Mexico, followed by Michigan, California, Massachusetts, and Texas. Michigan ranks high in the list, due to the extensive cross border nature of the auto industry. Imports from Mexico via Arizona BPOE by state are displayed in Figure 2 below. Click the “trend” tab to view the trend.
Figure 2: Imports from Mexico via Arizona Border Port of Entry by State
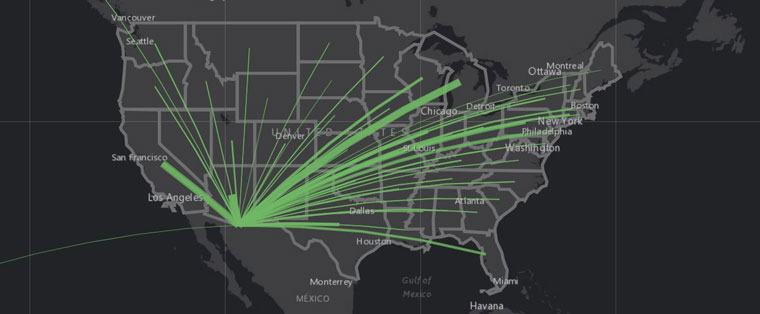
Click the image below to launch Figure 3 in a new window and explore how each U.S. state that exports to or imports from Mexico utilizes Arizona’s BPOE. Each line on the map represents that state’s trade flow via an Arizona BPOE. Click the line for a popup displaying the dollar value in exports and imports for each state. The map defaults to the Nogales port of entry, which is Arizona’s chief port of trade with its southern neighbor. Using the checkboxes in the right sidebar, you can select trade through Arizona’s other border ports (such as San Luis, Douglas, and even Phoenix).
Figure 3: State Imports and Exports by Arizona Border Port of Entry
For a wealth of information and analysis on Arizona's trade with Mexico, commodity flows and border crossings, visit Arizona Mexico Economic Indicators. Be sure to keep up with the latest data updates and articles by following AZMEX on Twitter.
References
1. U.S. Census Bureau (2018). State Trade Data. Retrieved from https://www.census.gov/foreign-trade/statistics/state/data/index.html#M


