Arizona's border ports are a key conduit through which the U.S. trades with Mexico. In fact, last year $31.5 billion dollars worth of merchandise crossed the border to and from Mexico via our ports. U.S. exports were valued at $13.4 billion and U.S. imports were valued at $18.1 billion.1 Merchandise trade includes tangible goods, like manufactured products, minerals and ores, and agricultural products.
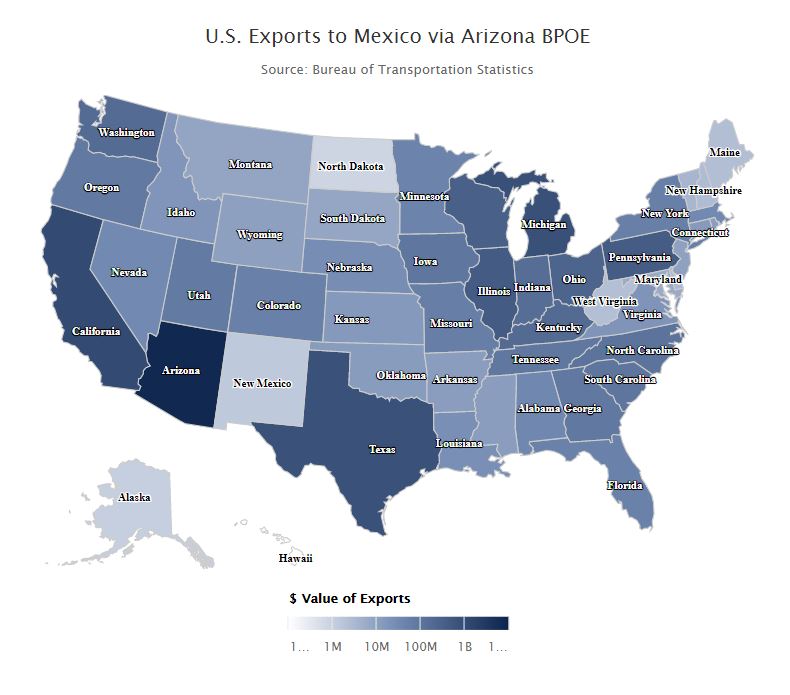
In 2015, all 50 U.S. States and the District of Columbia exported merchandise to Mexico via Arizona's border ports of entry (BPOE). Arizona remained the top user of its own ports exporting commodities worth $7.7 billion, followed by California with $1.1 billion. Michigan was in third with $801.8 million.
Michigan's prominence in this list is due in part to its connections with the automobile manufacturing industry in Sonora, most notably Ford Company in Hermosillo. Manufactured products designed in Michigan are shipped to Mexico where the labor intensive assembly process is completed.2 The final products are then exported from Mexico/ imported by the U.S., and in the maquiladora model, duties are imposed only on the value added by the assembly process.3 According to 2014 U.S. Census Bureau data, Michigan's top four exports (by six digit NAICS) are related to automobile manufacturing, and Mexico is its second largest export market, behind Canada.4 Other states to make the top ten include: Texas, Illinois, Pennsylvania, Wisconsin, Ohio, Kentucky, and Washington. Total exports by state which travel to Mexico via Arizona border ports of entry are displayed in figure 1.
Imports from Mexico via Arizona ports
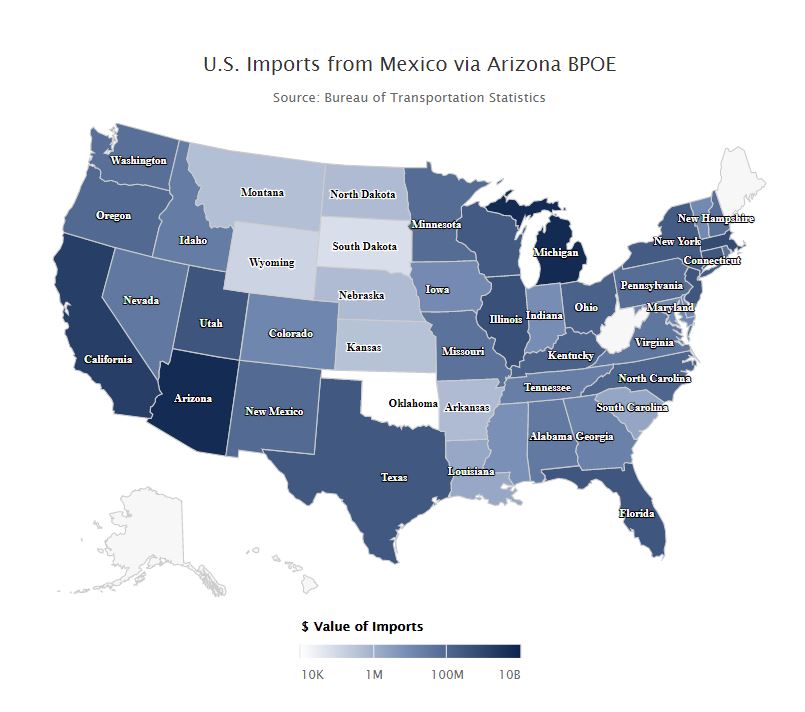
While Michigan's exports to Mexico via Arizona ports fell to third place in 2015, it rose to first place in the dollar value of imported merchandise from Mexico via Arizona BPOE, at $6.3 billion. Arizona was second with $5.9 billion, followed by California with $1.6 billion. Total imports by state from Mexico via Arizona BPOE are displayed in figure 2.
How it’s defined
Commodity flow data represent a subset of the dollar value of imports or exports between two trade partners, in this case identified by the portion which travels southbound or northbound via Arizona border ports of entry. In 2015, 40.7 percent, or $9.2 billion of Arizona’s total exports valued at $22.6 billion, were to Mexico, making it Arizona’s number one trading partner. A majority of Arizona’s exports to Mexico, about 83.7 percent ($7.7 billion), travelled through its own ports of entry, while the difference ($1.5 billion) travelled through other U.S.-Mexico ports of entry.
By specific port of entry
Arizona's six land ports of entry comprise the Nogales District. Among Arizona ports, Nogales handles the largest volume (by dollar value) of commodity flows between U.S. States that use Arizona ports, and Mexico. Nogales is followed by Douglas and San Luis. The interactive map below displays state exports and imports (commodity flows) broken down by port of entry/ exit for Arizona’s six land ports of entry, as well as Tucson and Phoenix. Click on the image to launch the application.
For more information about commodity flows as well as monthly and annual commodity flow data by Arizona, and major southern border ports of entry please visit
Arizona-Mexico Economic Indicators
Citations
1. Commodity Flow Data Source: Bureau of Transportation Statistics, North American Transborder Freight data, As of: 4/25/2016
2. Canas, J and Gilmer, R. (2009), The Maquiladora Changing Geography
3. Cañas, J., and Coronado, R. (2002). Maquiladora industry: Past, present and future. Business Frontier, 2, 1-5.
4. Total U.S. Exports from Michigan by 6-digit HS commodities (2014), U.S. Census Bureau, Foreign Trade Division, As of: 4/25/2016


