Research indicates that ‘hot spots’ of police reports for violent crime tend to coincide with high density areas of alcohol-serving establishments. The Centers for Disease Control and Prevention (CDC’s) National Center for Injury Prevention and Control recommend that metro areas utilize environmental and community planning strategies that target alcohol policies in order to reduce incidence of violent crime. Thus, an important first step in violent crime prevention and response planning is to map police reports of violent crime to alcohol outlets.
This white paper considers the relationships between the density of liquor licenses and police reports of violent crime in four cities in Arizona: Tucson, Tempe, Phoenix, and Flagstaff. Tabulation and comparison of assault, sexual offenses, kidnapping, robbery, and homicide in 2016 was conducted for all cities. Geospatial mapping was conducted for all assault and sexual offenses that were reported to police in the year 2016 in each city. Locations of establishments with liquor licenses for on-premises alcohol consumption (e.g., bars, clubs, restaurants) were also mapped for each city. The maps in this report use a heat feature to highlight high-density areas of alcohol-serving establishments. Violent crime is then mapped over the entire city.
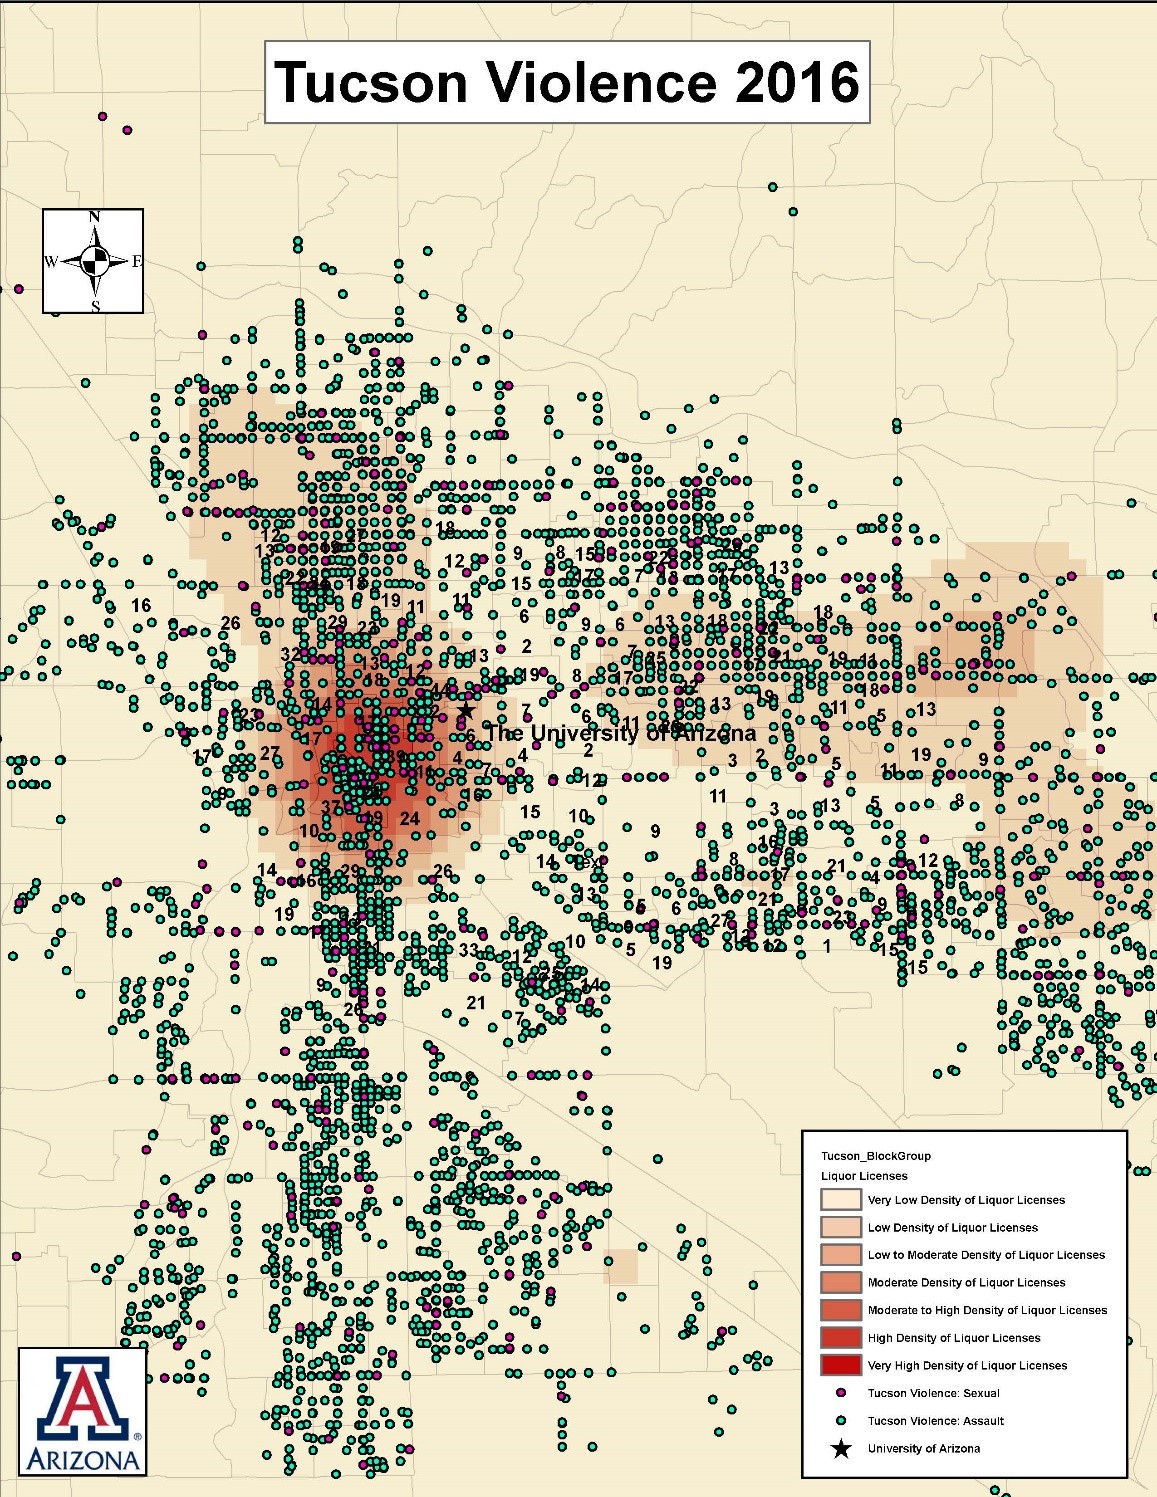
In each city, assault and sexual offenses make up the majority of violent crime. Research shows that alcohol consumption has a strong correlation with both violent perpetration and victimization. The geospatial analysis conducted in this study indicates that in three of the four cities (Tucson, Tempe, and Flagstaff), physical and sexual violence is higher in areas with many liquor licenses. These areas typically are located in city centers and around major university main campuses. It is especially concerning that these crimes are happening around university and college campuses because the emerging adult population in these areas may be unaware of and unequipped to minimize their risks of violent crime. For example, a section of the Tucson map (Figure 1) shows that just west of The University of Arizona, there is a distinct cluster of police reports for physical assaults (green dots) and sexual assaults (pink dots). The background of the map is darkest in places where there are many alcohol-serving establishments, and lighter in places where there are less alcohol-serving establishments. The cluster of police reports of violence is located in an area where there are many alcohol-serving establishments close together.
Figure 1: Density of Liquor Licenses, Assults, and Sexual Offenses in Tucson, AZ, 2016

Policy implications for state government, municipal police departments, and institutions of higher education include subsidizing/incentivizing violence prevention training for staff of alcohol-serving establishments, creating consistent crime coding in municipal databases statewide, conducting regular GIS mapping for crime prevention assessment, exploring opportunities to encourage victim reporting of sexual offenses, and re-assessing the impact of dry campus polices in the modern context. Recommendations for practice include increasing community policing strategies in areas with high densities of liquor licenses, endorsement of liquor licensees, seeking out violence prevention training for staff as a strategy for reducing liability incidents, developing college campus alcohol programming that specifically addresses situational characteristics of students’ off-campus drinking, and public education regarding the relationship between violent crime and community density of alcohol-serving establishments.


