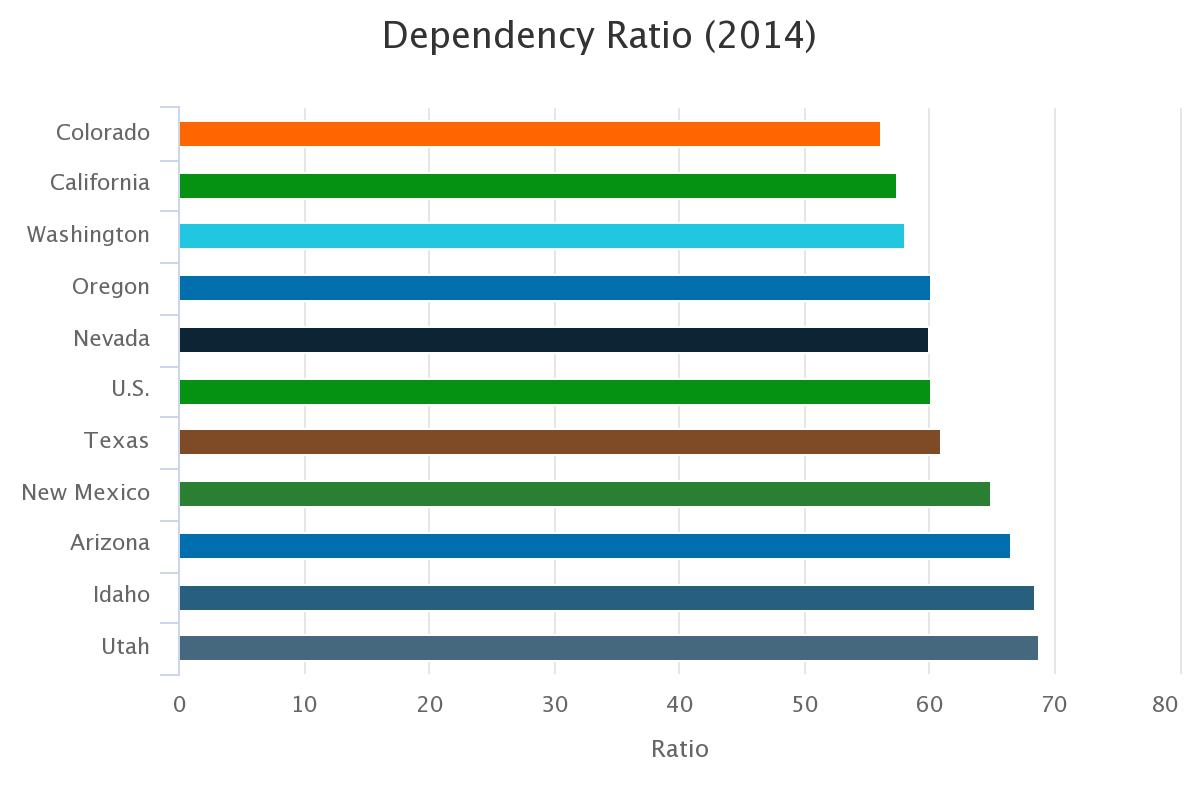
Arizona is a relatively young state, but it is also an old one. A basic way to track how balanced populations are age-wise is by using an age dependency ratio, which measures the proportion of young and older individuals in a region. The higher the ratio, the more slanted the population is toward older and/or younger residents. Arizona was higher in the ratio of both younger and older populations than the U.S. It had an overall dependency ratio of 66.6 compared to 60.2 for the nation. Utah had the highest age dependency ratio among states, followed by Idaho and then Arizona, while Colorado had the lowest.
Old age dependency (age 65 plus) and child dependency (under 18) ratios add together to make up the age dependency ratio. The term ‘dependency’ alludes to the fact that those who are either younger or older will draw more on public services (and therefore funding) than those who are of typical working age. For example, a large population of young people means more public funding needs to be spent on schools and the like, while a large older population could equate with drawing down of pension funds and possibly a higher demand for healthcare. As more of the Baby Boom generation reaches retirement age, there will be a sizable shift in age dependency ratios all across the U.S., though some states and areas will experience a larger portion of old age dependency ratio than others.
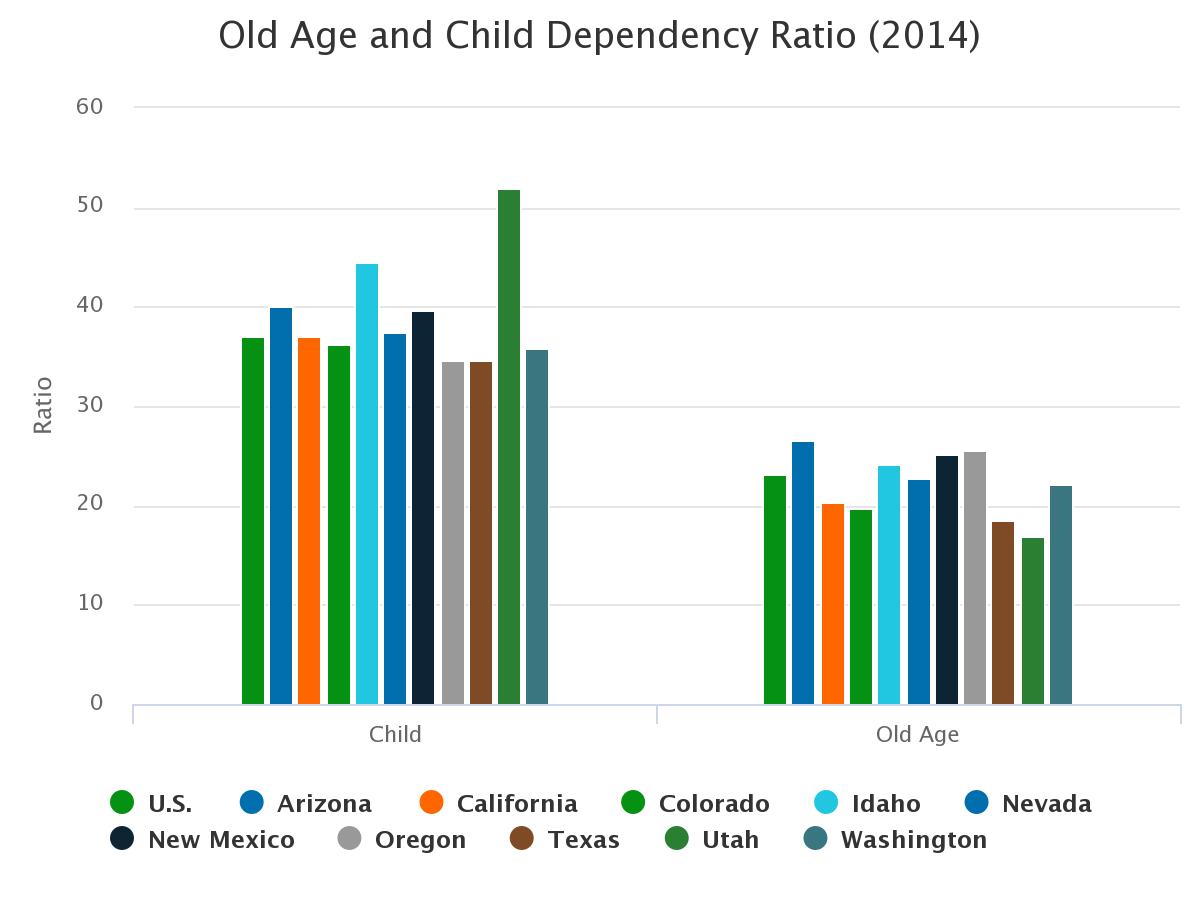
Arizona, at 26.5, had the highest old age dependency among western states tracked on the MAP Dashboard, but it also had a fairly high child dependency ratio of 40.1 (ranking 4th). Utah had both the lowest old age dependency (16.9) and the highest child dependency ratio (51.9) of all the states. Oregon had the lowest child dependency ratio.
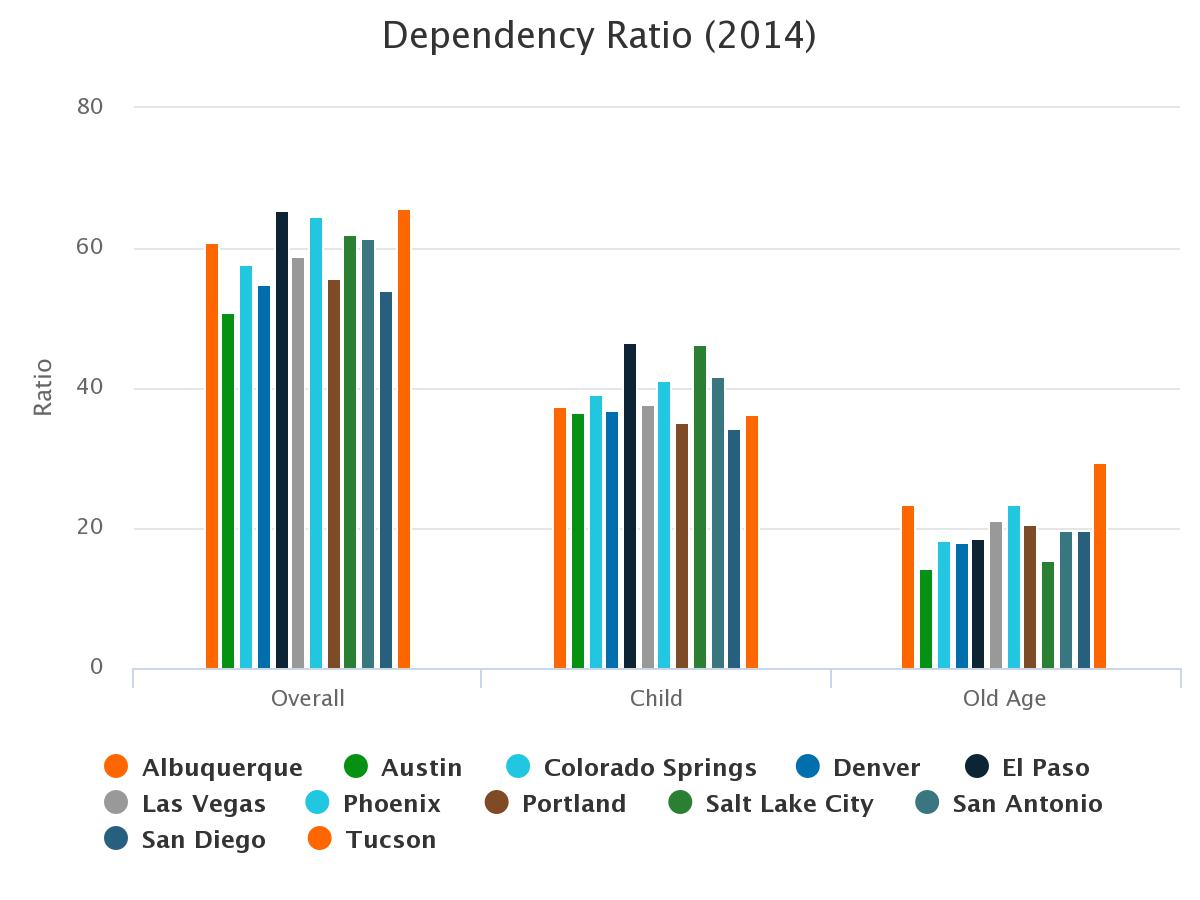
The Tucson metropolitan area had an age dependency ratio of 65.6 in 2014, placing it last among peer western metropolitan areas. Tucson also had the largest old age dependency ratio compared to all metropolitan areas. Austin, as 51.0, had the smallest overall dependency ratio, thanks to having the smallest ratio of old age dependency and the fourth smallest child dependency ratio. El Paso had the highest child dependency ratio (46.7), followed by Salt Lake City (46.4), while San Diego (34.4) had the lowest. At 36.2, Tucson had the third lowest child dependency ratio.
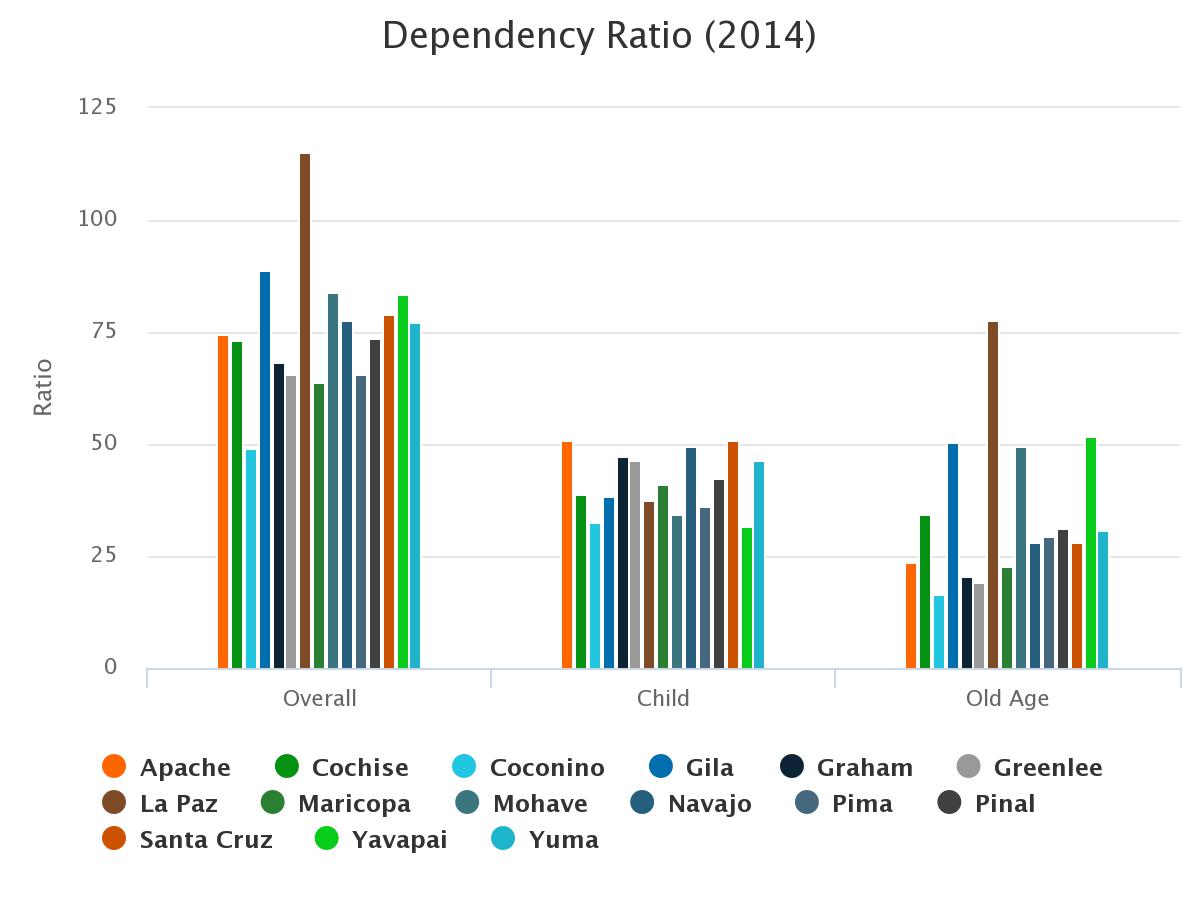
Arizona counties had a wide dispersion of dependency ratios. Pima County’s age dependency ratio of 65.6 placed it third lowest of Arizona counties, as it fell in the middle of the pack for old age dependency and had the 4th lowest child dependency ratio. Coconino County had the smallest age dependency ratio in the state at 49.0 and was the only county with a ratio less than that of the U.S., with the lowest old age ratio as well as the second lowest ratio of children. La Paz County, on the other hand, had a stunning dependency ratio of 115.1, due mostly to a much higher percentage of older residents within the county. The old age dependency ratio in La Paz County was 77.6 in 2014, higher than even the overall age dependency ratio of any of the other geographies tracked in this report. Apache and Santa Cruz counties had the highest ratio of children.
All states, metropolitan areas, and counties had an increase in the old age ratio and a decrease in the child ratio between 2000 and 2014, whether or not the age dependency ratio for that geography went up or down. This demonstrates the general shift in the overall age of the population, reflected the aging of the baby boomer population. The dependency ratio for Tucson increased 3.5% between 2000 and 2014, while Arizona’s increased 1.4% and the U.S. decreased 2.3%
| Overall | Old Age | child | |
|---|---|---|---|
| U.S. | -2.3% | 15.6% | -10.9% |
| Arizona | 1.4% | 22.8% | -9.1% |
| Tucson | 3.5% | 27.0% | -10.0% |
Age dependency ratios are calculated using annual population estimates from the U.S. Census Bureau, Population Estimates Program. Age dependency is a measure defined by dividing the combined under 18 years and 65 years and over by the 18-64 years population and multiplying by 100. Child dependency is measured by dividing the under 18 population by the 18-64 year old population and multiplying by 100. Likewise, old age dependency is the 65 and over populaton divided by 18-64 population and muliplying by 100.


