 Learn About Employment Growth by Industry in Tucson, Arizona MSA
How are we doing?
Growth Rate of Total NonFarm Employment (2024)
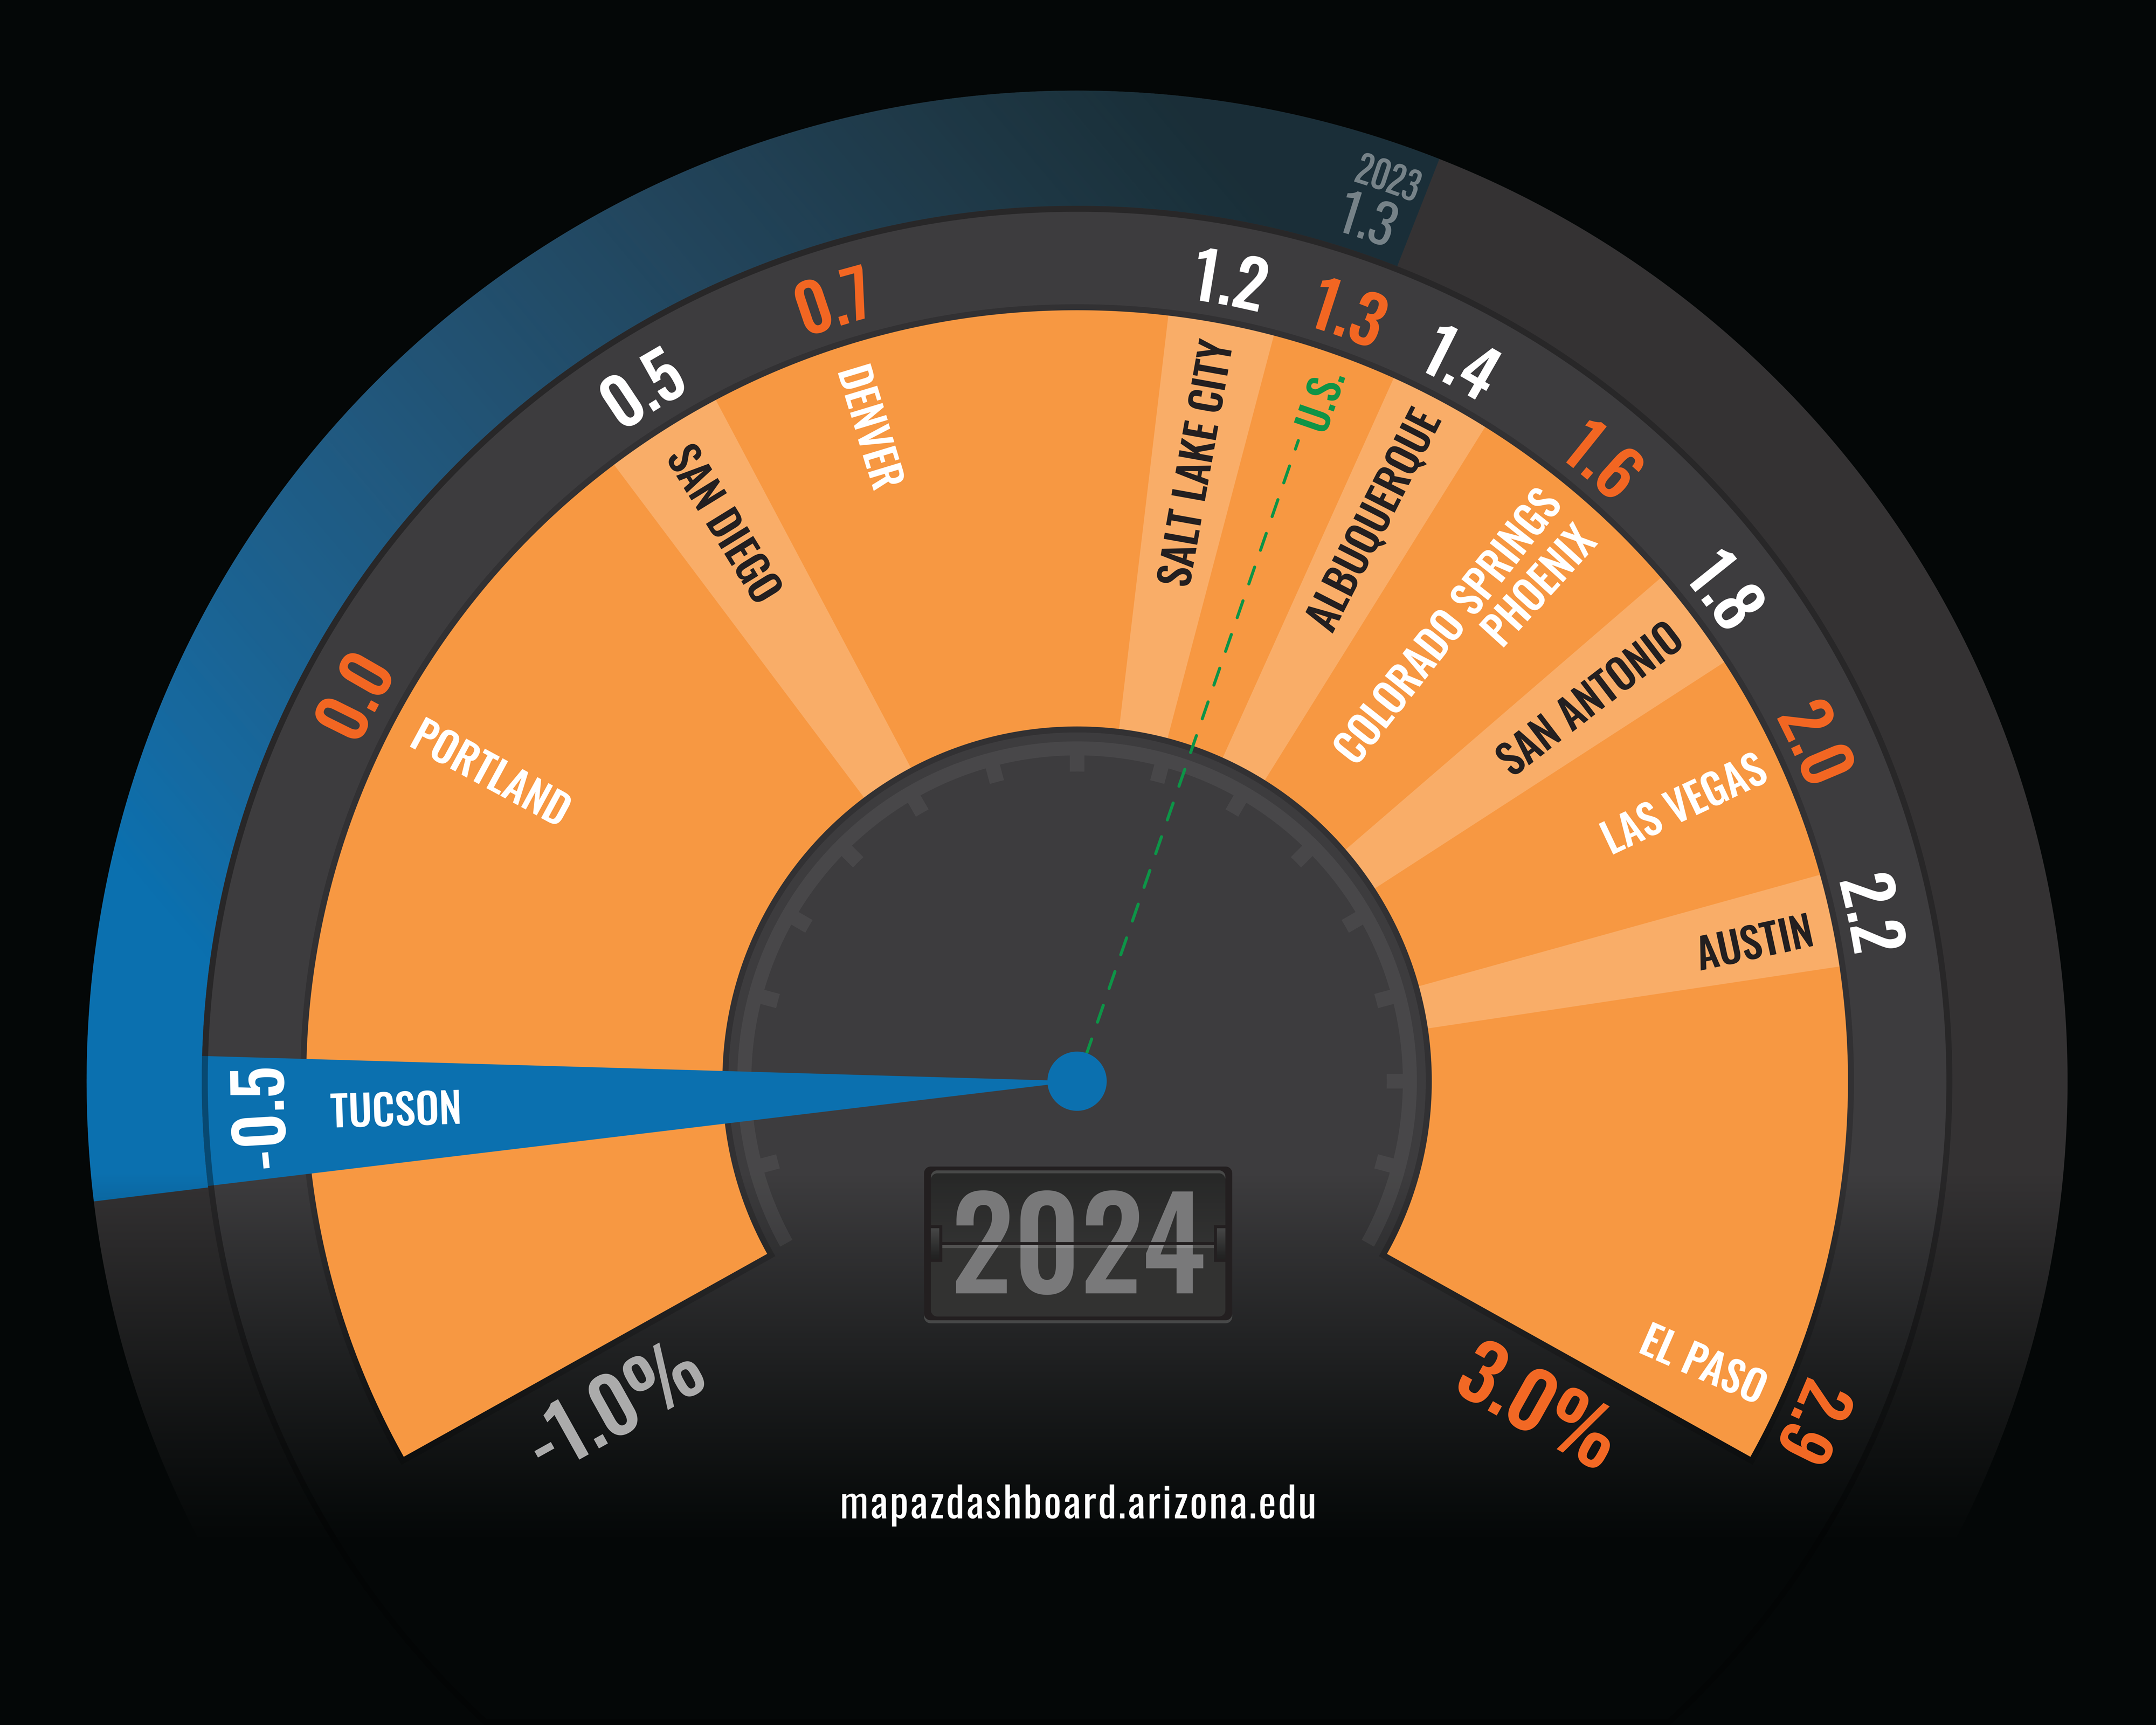
In 2024, total nonfarm employment for the Tucson Metropolitan Statistical Area (MSA) decreased by 0.5%. That was a substantial decrease from 2023, when growth was 1.3%. In comparison, Phoenix’s employment increased by 1.6%, and statewide jobs were up by 1.3%. Compared to peer western metropolitan statistical areas, Tucson’s job growth placed at the bottom among peers. El Paso posted the largest gain in employment at 2.9%, followed by Austin at 2.2%.
Tucson’s job losses were spread across multiple industries in 2024. The professional & business services industry posted the largest loss at approximately 3,458 jobs or 7.3%. That was followed by the financial activities sector which lost nearly 1,100 jobs or declined by 5.8%. Other industries that posted losses were leisure & hospitality; information; and trade, transportation, and utilities. The growth rate for each individual industry is available on the Comparison Page. While job growth has been slow relative to peer western MSAs over the past few years, it’s important to remember that Tucson has replaced all of the jobs lost during the early months of the pandemic. To view the preliminary monthly job data for Tucson, visit the award-winning Arizona’s Economy online magazine or download the free Arizona’s Economy smartphone app.
Why is it important?
The rate at which total employment changes is a key indicator of the overall performance of an economy. Employment growth reflects a region’s ability to generate jobs, income, and economic opportunities for those living in that region. Slow job growth can lead to increases in unemployment, reduced wages for those employed, and a decline in overall economic growth. Employment growth, subdivided by industry, informs us what industries dominate the employment mix and how that mix is changing over time.
How do we compare?
Arizona’s increase in total nonfarm employment of 1.3% was the sixth-highest among western states. Arizona’s job gains were driven mostly by the Phoenix MSA, which posted a 1.6% increase in 2024. Oregon posted the slowest growth in employment of the western states at 0.3%, followed by California at 0.7%. Nevada had the fastest at 1.9%. Nevada, like Las Vegas, was hit especially hard by the pandemic in 2020 due to the large share of jobs in leisure & hospitality.
What are the key trends?
Total employment growth in the Tucson MSA was slow to rebound from the 2008 – 2009 recession. However, employment growth in Tucson picked up in 2019 to 2.3%. That was the fastest growth posted since the 2008-2009 recession. Employment growth then rapidly declined in 2020 due to the coronavirus pandemic. Tucson’s loss of 4.5% in 2020 was slightly better than the national loss of 5.8%. In 2021, Tucson’s job growth increased by 2.1%. Tucson’s employment gains in 2022 grew even faster at 3.6%. That was slower than the state or the nation, but it was the fastest job growth in 16 years. In 2024, Tucson’s growth cooled and turned negative with a loss of 0.5%.
How is it measured?
Employment by industry is estimated based on a survey of employers. It reflects the number of jobs at establishments located within an area. An individual who works at two separate establishments during a year will be counted twice. Employment data come from the Bureau of Labor Statistics Current Employment Statistics (CES). The CES collects monthly survey data on employment, hours, and earnings of workers on nonfarm payroll.


