Water Use by Sector Tucson, Arizona MSA
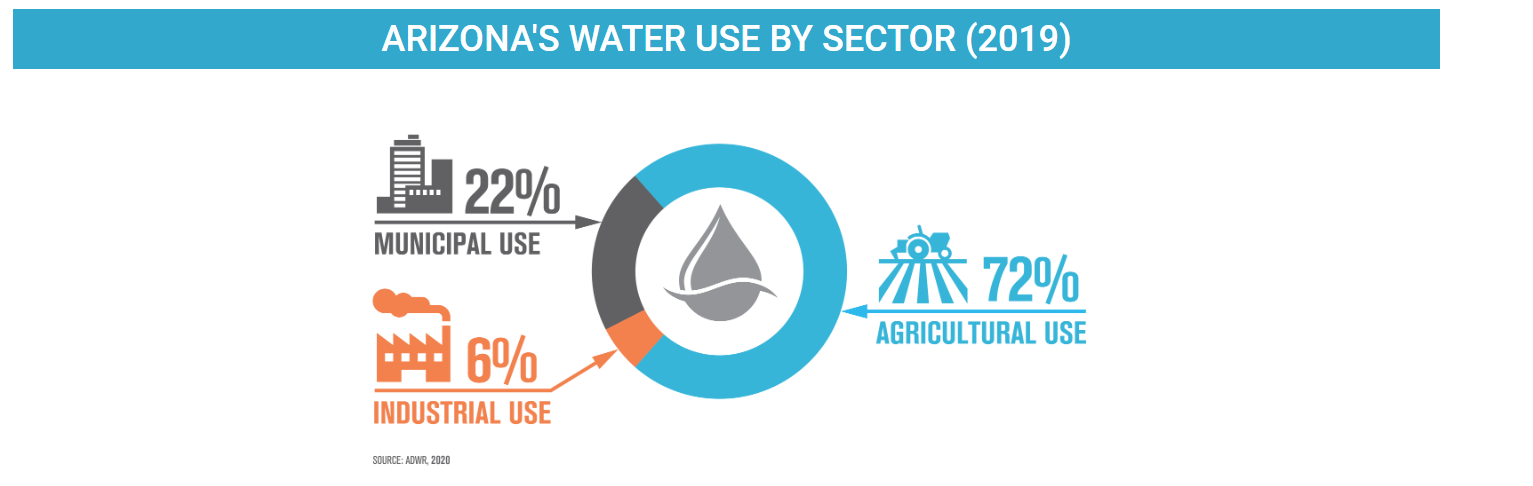
Have you ever wondered how much water you use daily? Or how much water is necessary to grow crops, fill your swimming pool, or in industrial processes? Arizona’s water supply can be divided into three main categories: agriculture, domestic, and industrial use. In 2019, the Arizona Department of Water Resources (ADWR) reported that 22% of the water supply went to municipal purposes, 6% to industrial uses, and 72% to agriculture (Figure 1). The latest data from ADWR reports that the state of Arizona used 7.0 million acre-feet of water in 2017. An acre-foot of water is approximately 326,000 gallons, or the amount of water it would take to flood one acre of land (about the size of a football field) to a depth of one foot. Arizona’s total water use has declined over the years despite increasing population due to the creation of ADWR and its implementation of mandatory water conservation requirements.
Figure 1: Arizona’s Water Use by Sector 2019 (Source: ADWR)
WHY IS IT IMPORTANT
Arizona is currently in a megadrought. That means the state has experienced some level of drought condition for more than 20 years. A recently published article from Nature Climate Change found that since 2000, the southwest has been unusually dry due to low precipitation totals and heat. No other 22-year period since at least 1901 was as dry or as hot. That has serious implications for Arizona’s water as more than 50% of the water supply is from the Colorado River or other in-state rivers. In 2021 and then again in 2022, Lake Mead and Lake Powell reached historical lows, triggering unprecedented restrictions on Colorado River usage.
The Colorado River Compact was negotiated in 1922 and allocated water rights to the upper basin (Colorado, New Mexico, Utah, and Wyoming) and lower basin (Arizona, California, and Nevada) states. The upper basin states receive 7.5 million acre-feet a year, while the lower basin states receive 8.5 million acre-feet. A later agreement was agreed upon with Mexico to receive 1.5 million acre-feet. The Colorado River Compact allows for 17.5 million acre-feet a year. However, over the past 100 years, the river’s actual flow has been less than 15 million acre-feet a year. Once the drought hit in 2020, the river’s annual flow fell further to just 12 million acre-feet a year. Arizona has the third-largest allotment among the seven states at 2.8 million acre-feet annually.
After nearly a year of negotiations between the three lower basin states on how to reduce their Colorado River allocations, they finally reached an agreement in late May of 2023. The agreement will save up to 3 million acre-feet of water over the next three years. The proposal includes a bid to conserve at least half of its total by the end of 2024. The water cuts would be split between cities, tribes, and farmers with short-term payments from the federal government in exchange for the water savings. The water cuts could be compensated through the Inflation Reduction Act. At the time of publication of this article, the agreement was pending approval by the Interior Department.
As of May 2023, Lake Powell has risen more than 20 feet since its all-time low due to record snowpack in the Colorado Rockies. Lake Mead has also risen more than 11 feet since hitting its record low. Lake Mead’s increase is mainly due to extra water released from Lake Powell, which is located upstream.
ARIZONA’S WATER SUPPLY
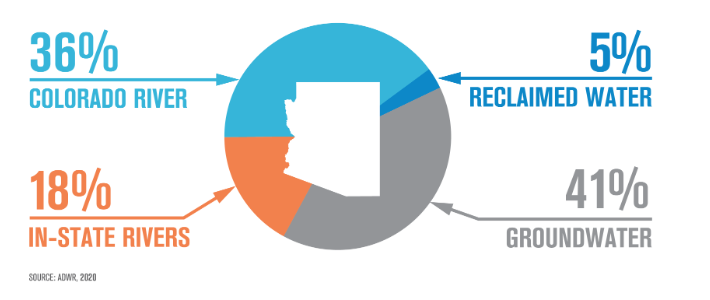
Arizona's water supply is used primarily for agriculture, domestic, and industrial purposes. Water is often supplied through public supply deliveries for domestic and commercial uses. Water can also be self-supplied through groundwater or surface water withdrawals, as is the case for the agricultural and industrial sectors. Arizona's water sources include the Colorado River and other in-state rivers, groundwater, and reclaimed water, as illustrated in Figure 2 from the ADWR.
Figure 2: Arizona's Water Supply (Source: ADWR)
PUBLICLY SUPPLIED WATER
In 2015, 80.57% of the water supplied through public deliveries was for domestic use (Figure 3), according to data from the United States Geological Survey. Domestic water is used for residential indoor and outdoor household purposes. An additional 19.39% was supplied for commercial use. Commercial includes water used for motels, hotels, restaurants, office buildings, and other commercial facilities, military and nonmilitary institutions. Thermoelectric includes water used in the process of generating electricity. In 2015, less than 1% of publicly supplied water in Arizona was delivered for thermoelectric purposes. In addition to publicly supplied water sources, the commercial and thermoelectric sectors also use self-supplied water sources.
In Arizona, there were no publicly supplied deliveries to the industrial sector in 2015. Industrial water use includes the production of chemicals, food, mining, paper, petroleum refining, and steel production.
Figure 3: Arizona’s Publicly Supplied Water by Sector (2015)
SELF-SUPPLIED WATER SUPPLY
Irrigated agriculture makes up the largest user of water in the state of Arizona by far. In 2015, more than 4,400 million gallons of water per day were withdrawn from the water supply for crop irrigation. Of that, 42.9% came from groundwater withdrawals and 57.1% from surface water (Figure 4). The Arizona Department of Water Resources estimates that irrigated agriculture consumes about 74% of the total available water supply. Irrigation for golf courses accounted for an additional 122 million gallons of water withdrawn daily. Groundwater withdrawals accounted for 66.5% of irrigation for golf courses, while 33.5% was from surface water. Additional sectors that use self-supplied water sources include Industrial, Commercial, Mining, Livestock, and Aquaculture (fish hatcheries). Only 2.4% of total domestic water used in Arizona comes from self-supplied sources, of that all of it is from self-supplied groundwater withdrawals.
Figure 4: Self-Supplied Water Use (Groundwater vs Surface Water) (2015)
It is worth noting that agriculture and golf courses also use reclaimed wastewater sources. Reclaimed water use for agriculture accounts for less than 2% of total irrigation for agriculture. However, reclaimed water use for golf courses is substantially higher at about 28.0%.
HOW DOES ARIZONA COMPARE?
In 2015, publicly supplied water to Arizonans for domestic and commercial purposes used 181 gallons per capita per day (GPCD), according to the latest data from the United States Geological Survey (USGS). Public supply deliveries include water from a public supplier to users for domestic, commercial, industrial, thermoelectric-power, or public use. Arizona had the fourth highest rate of publicly supplied water use per capita compared to the other western states (Figure 5). Idaho had the highest at 219 GPCD, and Texas the lowest at 110 GPCD.
Figure 5: Publicly Supplied Water Use (2015)
The amount of water used per capita per day fell significantly when considering just domestic use. Residential or domestic customers used 146 GPCD in Arizona in 2015. That was still considerably higher than many of the western states (Figure 6). Idaho had the highest residential water use at 186 GPCD, and Texas and New Mexico had the lowest at 81 GPCD.
Figure 6: Residential (Domestic) Water Use (2015)
Interestingly, the amount of water used per capita per day was lower for those in Arizona who were self-supplied water users compared to those receiving their water from a public water source. In 2015, those that were self-supplied used 110 GPCD compared to publicly supplied customers at 146 GPCD (Figure 7). This trend was not consistent across the western states, with most self-supplied water users having a higher GPCD rate than those that were publicly supplied. It is worth noting that self-supplied users account for a very small percentage of total water users in Arizona at 2.4%. That was on the lower end compared to the other western states. Idaho had more than 20% of their water users as self-supplied, while Oregon, Washington, and New Mexico, had more than 10%.
Figure 7: Domestic Water Use (Self-Supplied vs Public Supply)
The rate of residential water used per day varied substantially among the Arizona counties in 2015. Mohave County residents used 190 GPCD, followed closely by Greenlee County at 187 GPCD. Gila and Yavapai Counties had the lowest rates of residential water use at 92 and 93 GPCD, respectively (Figure 8). Individual utility data is not readily available. However, the MAP tracks the GPCD for Tucson Water. Tucson Water’s residential GPCD was 80 GPCD, well below Pima County’s rate of 135.
Figure 8: Residential (Domestic) Water Use for Arizona Counties (2015)
CONSERVATION
Economies run on water. You need water for households, agriculture, businesses, the production of goods and services, mining, livestock, and so on. Essentially, life does not exist without access to water. A stable and secure long-term water supply is necessary for Arizona’s economy to grow. Arizona’s conservation programs have helped reduce the state’s water use over the past 60 years.
Arizona has saved nearly 3 trillion gallons of water for future use. That is equivalent to serving the city of Phoenix for 30 years, according to ADWR. In 1980, Arizona implemented the Groundwater Management Act, which required that the active-management areas (AMAs) provide an assured water supply capable of sustaining its residents for at least 100 years. The AMAs are made up of five regions throughout the state (Prescott, Phoenix, Pinal, Tucson, and Santa Cruz). Each region was identified because of its heavy reliance on mined groundwater. Each AMA has its own primary goal. In Tucson, that goal is to reach a safe yield by 2025. Safe yield occurs when no groundwater over annual replacement rates is withdrawn. The Kyl Institute at Arizona State University notes that the goal of safe-yield has been fundamental to the state’s efforts to safeguard groundwater, but it is insufficient to ensure the long-term sustainability of groundwater supplies in the AMAs. They suggest additional actions are necessary in a recent article “The Myth of Safe-Yield”. The ADWR conservation efforts do have additional mandatory requirements in place for municipal, industrial, and agricultural use. For example, no new agricultural acreage can be brought into production. To review all of ADWR’s conservation efforts visit their website.
WHAT IS NEXT?
The water data is released from the USGS on five-year intervals. We anticipate the 2020 data to be released later this year. The MAP Dashboard’s residential water use indicator will be updated as soon as the new data is released. Check back for more water-related articles in the future.